悬崖边上的舞者,记7.2生产数据库灾难事件
作者:张子良
版权所有,转载请注明出处
引子:出事了
7月2日是一个难得的大晴天,一段时间以来桂林一直在下雨,一直下,害的我减肥的计划一再的泡汤,因为下雨每天早上的跑步变成了观雨。和往常一样,准时来到单位,却不准时的得到一个消息:昨晚前置生产数据库出问题了,连接不上。本能的反应,日志满了,或者服务器交换空间不足。急忙赶到运维间,经询问夜间值班人员,发现后续的情况是:logsegment日志空间确实是满了,发现问题后,运维人员采用dump日志的方式进行处理,却发现dump根本不被执行,无奈最后只得采用增加log设备空间的方式,进行了紧急处理。现在的问题是到底是什么原因引起的log空间的陡然间增加呢?
一、日志分析:发现了问题,却无法定位?
取了数据库运行日志,展开分析,发现了以下问题:
00:06:00000:00912:2013/07/02 03:31:53.98 server Space available in the log segment has fallen critically low in database 'XXXDB'. All future modifications to this database will be suspended until the log is successfully dumped and space becomes available.
00:01:00000:00046:2013/07/02 03:31:54.08 server Error: 1105, Severity: 17, State: 4
00:01:00000:00046:2013/07/02 03:31:54.09 server Can't allocate space for object 'syslogs' in database 'XXXDB' because 'logsegment' segment is full/has no free extents. If you ran out of space in syslogs, dump the transaction log. Otherwise, use ALTER DATABASE to increase the size of the segment.
00:01:00000:00046:2013/07/02 03:31:54.09 server DUMP TRANSACTION for database 'XXXDB' could not truncate the log. Either extend the log using ALTER DATABASE ... LOG ON command or eliminate the oldest active transaction in database 'frtdb' shown in syslogshold table.
00:01:00000:00046:2013/07/02 03:31:54.09 server DUMP TRANSACTION for database 'XXXDB' could not truncate the log. Either extend the log using ALTER DATABASE ... LOG ON command or eliminate the oldest active transaction in database 'XXXDB' shown in syslogshold table.
00:01:00000:00046:2013/07/02 03:31:54.09 server background task message: LOG DUMP:'logsegment' for 'XXXDB' dumped!
问题很明显:2013/07/02 03:31:53就已经出现了空间不足的情况,2013/07/02 03:31:54.08出现了log空间已满的情况。2013/07/02 03:31:54.09执行了Dump操作,但是失败了,无奈那么为什么会失败呢?又是什么操作导致了日志空间的剧烈增长呢?继续跟踪日志。
二、发现死锁:死锁会导致日志空间满吗
继续向上追溯发现在此之前曾经发现出现过死锁的情况,具体日志如下:
00:02:00000:00796:2013/07/01 07:13:24.33 server Deadlock Id 1 detected
Deadlock Id 1 detected. 1 deadlock chain(s) involved.
Deadlock Id 1: Process (Familyid 0, Spid 1117, Suid 4) was executing a UPDATE command in the procedure 'insprep0' at line 1 at nested level 1.
Deadlock Id 1: Process 1117 was involved in application ''.
Deadlock Id 1: Process 1117 was involved on host name ''.
Deadlock Id 1: Process 1117 was involved in transaction '$user_transaction'.
SQL Text:
Executing procedure: *00111700009969_3e59fe
Subordinate SQL Text:XXXXX
Deadlock Id 1: Process (Familyid 0, Spid 796, Suid 4) was executing a FETCH CURSOR command at line -1.
Deadlock Id 1: Process 796 was involved in application ''.
Deadlock Id 1: Process 796 was involved on host name ''.
SQL Text: XXXXXX
Deadlock Id 1: Process (Familyid 0, Spid 796) was waiting for a 'shared page' lock on page 60607 of table 't_merch_det' in database 'frtdb' but process (Familyid 0, Spid 1117) already held a 'exclusive page' lock on it.
Deadlock Id 1: Process (Familyid 0, Spid 1117) was waiting for a 'exclusive page' lock on page 5866141 of table 't_merch_det' in database 'frtdb' but process (Familyid 0, Spid 796) already held a 'shared page' lock on it.
Deadlock Id 1: Process (Familyid 0, Spid 796) was chosen as the victim.
Victim process host = `', user = `sysadmin' program name = `' host processes = `13697416' .
End of deadlock information.
00:00:00000:01262:2013/07/01 14:49:42.27 server Deadlock Id 2 detected
Deadlock Id 2 detected. 1 deadlock chain(s) involved.
Deadlock Id 2: Process (Familyid 0, Spid 813, Suid 4) was executing a FETCH CURSOR command at line -1.
Deadlock Id 2: Process 813 was involved in application ''.
Deadlock Id 2: Process 813 was involved on host name ''.
Deadlock Id 2: Process 813 was involved in transaction '$user_transaction'.
SQL Text: XXXXXX
Deadlock Id 2: Process (Familyid 0, Spid 1262, Suid 4) was executing a UPDATE command in the procedure 'insprep0' at line 1 at nested level 1.
Deadlock Id 2: Process 1262 was involved in application ''.
Deadlock Id 2: Process 1262 was involved on host name ''.
Deadlock Id 2: Process 1262 was involved in transaction '$user_transaction'.
SQL Text:
Executing procedure: *00126200040493_8f416a
Subordinate SQL Text: XXXXXXX
Deadlock Id 2: Process (Familyid 0, Spid 1262) was waiting for a 'exclusive row' lock on row 21 page 10073 of the 'XXXXXX' table in database 'frtdb' but process (Familyid 0, Spid 813) already held a 'exclusive row' lock on it.
Deadlock Id 2: Process (Familyid 0, Spid 813) was waiting for a 'shared row' lock on row 11 page 18705629 of the 'XXXXXX' table in database 'frtdb' but process (Familyid 0, Spid 1262) already held a 'exclusive row' lock on it.
Deadlock Id 2: Process (Familyid 0, Spid 1262) was chosen as the victim.
Victim process host = `', user = `sysadmin' program name = `' host processes = `13500790' .
End of deadlock information.
根据分析发现,死锁的时间发生在2013/07/01 14:49:42.27,而发生死锁的进程也被终止,如果是由此原因导致的问题的话,爆发时间对不上。根据日志清理的定时计划,再次阶段出现的问题,日志应该已经被清理,所以可以排除掉这种情况。
三、数据库变更:重启过,都变更了什么?
继续向上追溯,发现6.30日数据库曾经被重启过,发现数据库参数也曾经发生过变化:
00:00:00000:00013:2013/06/30 01:10:56.60 server Completed filling free space info for database 'XXXDB'.
00:00:00000:00013:2013/06/30 01:10:56.61 server Started cleaning up the default data cache for database 'XXXDB'.
00:00:00000:00013:2013/06/30 01:10:57.04 server Completed cleaning up the default data cache for database 'XXXDB'.
00:00:00000:00013:2013/06/30 01:10:57.04 server Checking external objects.
00:00:00000:00013:2013/06/30 01:10:57.46 server The transaction log in the database 'XXXDB' will use I/O size of 8 Kb.
00:00:00000:00013:2013/06/30 01:10:57.46 server Database 'XXXDB' is now online.
00:00:00000:00001:2013/06/30 01:10:57.47 server Recovery has restored the value of 'local async prefetch limit' for '64K' pool in 'default data cache' from '80' to 'DEFAULT'.
00:00:00000:00001:2013/06/30 01:10:57.47 server Recovery has restored the value of 'local async prefetch limit' for '8K' pool in 'default data cache' from '80' to 'DEFAULT'.
00:00:00000:00001:2013/06/30 01:10:57.57 server Recovery has restored the original size for '64K' pool and '8K' pool in 'default data cache'.
00:00:00000:00001:2013/06/30 01:10:57.58 server Recovery complete.
00:00:00000:00001:2013/06/30 01:10:57.59 server ASE's default unicode sort order is 'binary'.
00:00:00000:00001:2013/06/30 01:10:57.60 server ASE's default sort order is:
00:00:00000:00001:2013/06/30 01:10:57.60 server 'nocase_cp936' (ID = 52)
00:00:00000:00001:2013/06/30 01:10:57.60 server on top of default character set:
00:00:00000:00001:2013/06/30 01:10:57.60 server 'cp936' (ID = 171).
那么是否是数据库参数变更导致的问题,这个地方是我重点怀疑的地方,但是始终没有找到数据支撑,变更这些参数,是否就是导致问题的根源呢?我需要更多的数据的支撑。
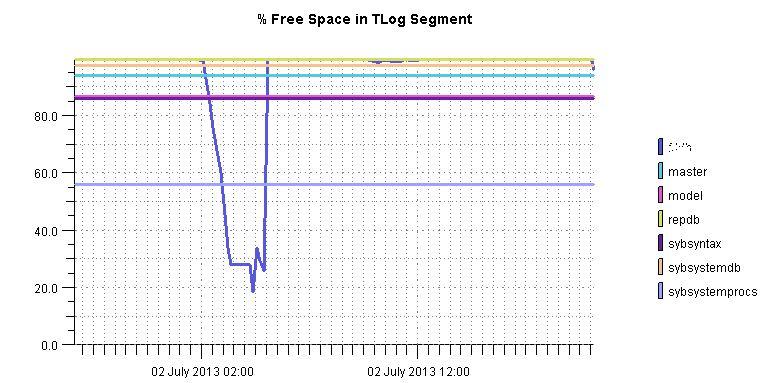
四、性能监控:陡然增加的日志空间占用,究竟发生了什么?
好在部署了数据库性能监控监控软件,通过分析性能监控图表,发现7.2凌晨2点至3点半,数据库log空间出现了激增,空间占用率呈直线60度上升,直至100%。那么可以肯定的是,在2点的时候,一定是有什么大事务的数据库操作?那么究竟是什么操作呢?
五、柳暗花明:日志,还是日志
既然数据库本身的日志无法满足分析的需要,那么前置平台日志,肯定会有相关的记录,跟踪前置日志,终于发现,7.2日凌晨2点的-3点半期间确实有一个大的数据库事务发生,那就是从当前交易流水表复制交易记录到历史交易记录表,记录数1100w条,单表需要数据库存储空间5G,执行完成插入操作后,需要进行后续的删除操作,而恰在此时时出现了日志空间不足的情况。新的疑问就出现了,为何这个问题之前没有发生呢?
六、历史问题:为何以前没有发生问题呢
通过跟踪6月30日以前的日志发现,执行当前表到历史表的数据拷贝的操作,都是失败的。直接返回-1,失败的原因是由于当前数据库可用空间不足或者其他原因,正在跟踪分析中。。。