zoukankan      html  css  js  c++  java
  • echarts 内容显示值在图中显示,不显示交互效果,只是静态图


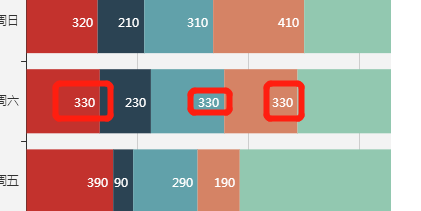
    解决方案:可以使用formatter函数去结局,代码如下:


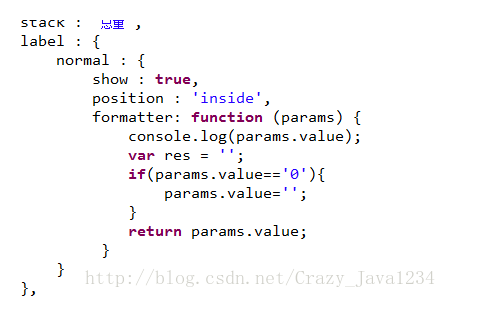
    series: [
                    {
                      name: '',
                      type: 'pie',
                      radius: ['50%', '85%'],
                      avoidLabelOverlap: false,
                      label: {
                        // show: false,
                        // position: 'center',
                        normal: {
                          show: true,
                          // formatter: '{c}',
                          position: 'inside',
                          color: '#fff',
                          formatter: function(params) {
                            let res = ''
                            if (params.value == '0') {
                              params.value = ''
                            }
                            return params.value
                          }
                        }
                      },
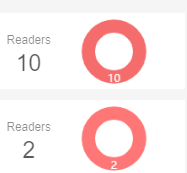
    loadCompAlertEchart() {
          if (this.companyList.length > 0) {
            this.$nextTick(() => {
              this.companyList.forEach((company, index) => {
            // 颜色显示
                const arrShow = [
                  { name: 'Off-line < 5 mins ', value: company.less_count, itemStyle: {color: '#E6A23C'}},
                  { name: 'Off-line > 5 mins ', value: company.more_count, itemStyle: {color: '#F56C6C'} },
                  { name: 'On-line reader ', value: parseInt(company.reader_count - company.offline_reader_count), itemStyle: {color: '#67C23A'} }
                ]
                const currentCompObj = {
                  tooltip: {
                    show: false,
                    trigger: 'item',
                    formatter: '{b}: {c}',
                    confine: true,
                    extraCssText: 'font-size: 7px'
                  },
                  series: [
                    {
                      name: '',
                      type: 'pie',
                      radius: ['50%', '85%'], // 控制饼图的宽度
                      avoidLabelOverlap: false,
                      label: {
                        // show: false,
                        // position: 'center',
                        normal: {
                          show: true,
                          // formatter: '{c}',
                          position: 'inside',
                          color: '#fff',
                          formatter: function(params) {
                            let res = ''
                            if (params.value == '0') {
                              params.value = ''
                            }
                            return params.value
                          }
                        }
                      },
                      // emphasis: {
                      //   label: {
                      //     show: false,
                      //     fontSize: '30',
                      //     fontWeight: 'bold',
                      //     color: '#fff'
                      //   }
                      // },
                      labelLine: {
                        show: false
                      },
                      // color: ['#CECECE', '#3BA0FF'],
                      data: arrShow,
              // 不显示交互效果,鼠标放上去pie图是静态的 hoverAnimation:
    false } ] }; const currentCompChart = Echarts.init( document.getElementById(company.identifier) ); currentCompChart.setOption(currentCompObj) }) }) } },

    记录自己的采坑之路,需要时方便查找
  • 相关阅读:
    字节跳动--今日头条iOS客户端启动速度优化
    RSA加密
    几种浏览器
    Linux定时任务crontab无法执行
    Python报错ImportError: No Module Named Typing的解决
    微信小程序:A、B两个小程序相互跳转,出现点击A小程序底部导航栏菜单,第一次点击无法跳转B小程序,需要点击第二次才会触发跳转到B小程序
    c# core 生成随机图文验证码
    携程Apollo统一配置管理中心
    WPF程序中嵌入winForm窗体
    sqlserver 转 postgresql
  • 原文地址:https://www.cnblogs.com/hahahakc/p/14431854.html
Copyright © 2011-2022 走看看