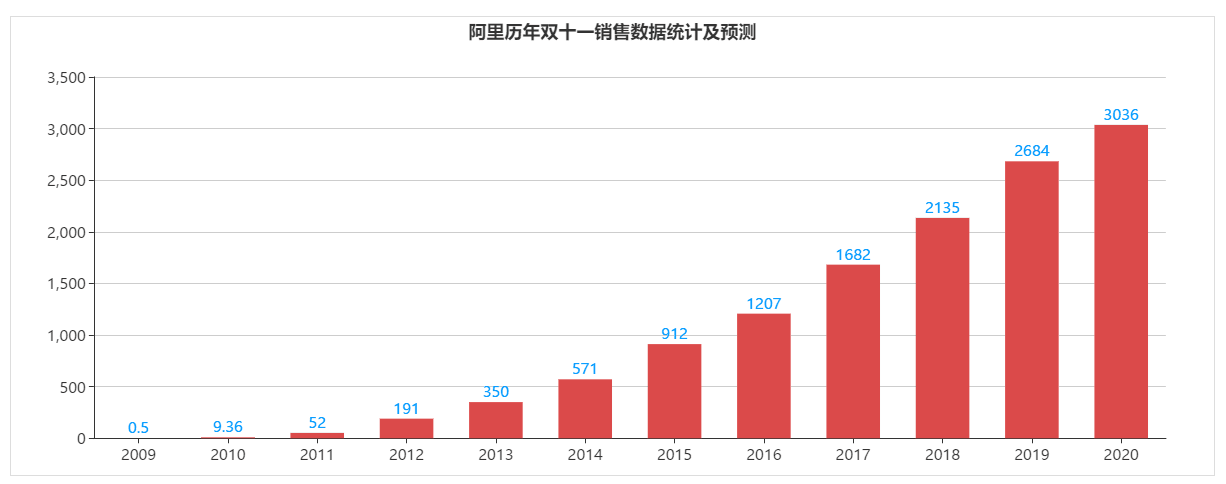
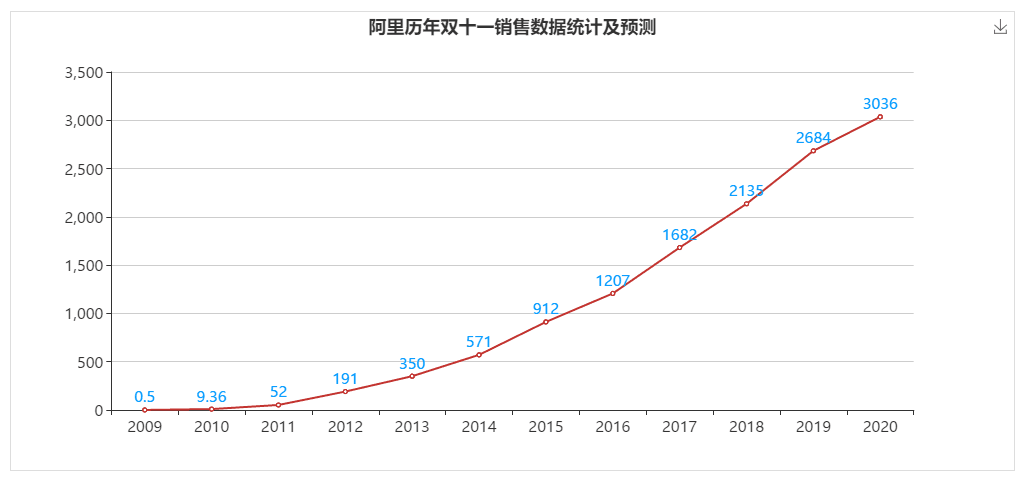
zoukankan      html  css  js  c++  java
  • echarjs—阿里历年双十一销售数据统计及预测

    阿里双十一数据统计

    <!DOCTYPE html>
    <html>
      <head>
      <title>阿里历年双十一销售数据统计及预测</title>
      
      <meta http-equiv="pragma" content="no-cache">
      <meta http-equiv="cache-control" content="no-cache">
      <meta http-equiv="expires" content="0">  
      <meta http-equiv="keywords" content="keyword1,keyword2,keyword3">
      <meta http-equiv="description" content="This is my page">
      <link rel="stylesheet" href="css/bootstrap.min.css">
      
      
    </head>
    
    <body>
        <section class="hj-second-page-section">
          <div class="container-fluid">
            <div class="rows">
              <div class="col-xs-12 col-sm-12 col-md-12 col-lg-12">
                <div class="rows">
                  <div class="col-xs-12 col-sm-12 col-md-12 col-lg-12 hj-jumbotron-div">
                    <div class="panel panel-primary ng-scope">
                     
                     <!-- pannel start -->
                     <div class="panel-body vc-pannel-body-toggle">
                         <div class="rows ng-scope">
                           <div class="panel-body vc-msg-panel-body">
                             <div class="row">
                              
                              <div class="col-xs-12 col-sm-12 col-md-6 col-lg-6">
                                 <div id="rt_chart1" style=""></div>
                              </div>
                              
                             </div>
                          </div>
                         </div>
                         
                     </div>
                    
                     <!-- pannel end -->
                    </div>
                  </div>
                </div>
              </div>
            </div>
          </div>
        </section>
          
        
        <script src="js/echarts2.js"></script>
        <script src="js/jquery-2.2.3.min.js"></script>
        
        <script>
          /**
           * @description 绘制折线图
           * @date 2019-11-13
           * @param 
           */
          function initChart1() {
            $("#rt_chart1").height(460);
            $("#rt_chart1").width(1005);
            $("#rt_chart1").css("border","1px solid #ddd");
            var myChart1 = echarts.init(document.getElementById("rt_chart1"));
    
            var option1 = {
                    title: {
                        text: '阿里历年双十一销售数据统计及预测',
                        //subtext: '数据来源于网络',
                        sublink: '',
                        left: 'center'
                    },
                    tooltip : {
                trigger: 'axis'
              },
                    toolbox: {
                        show: true,
                        feature: {
                            saveAsImage: {}
                        }
                    },
                    legend: {
                data:[2009,2010,2011,2012,2013,2014,2015,2016,2017,2018,2019,2020]
              },
                    xAxis: {
                        type: 'category',
                        data: [2009,2010,2011,2012,2013,2014,2015,2016,2017,2018,2019,2020]
                    },
                    yAxis: {
                        type: 'value'
                    },
                    series: [{
                        itemStyle: {
                                 normal: {
                                     label: {
                                         show: true,
                                         position: 'top',
                                         textStyle: {
                                             color: '#0099ff'
                                         }
                                     }
                                }
                           },
                        data: [0.5,9.36,52.0,191.0,350.0,571.0,912.0,1207.0,1682.0,2135.0,2684.0,3036.0],
                        type: 'line'
                    }]
                };


            // 为echarts对象加载数据
            myChart1.setOption(option1);
          }
    
          initChart1();
        </script>
    </body>
    </html>

    <!DOCTYPE html>
    <html>
      <head>
      <title>阿里历年双十一销售数据统计及预测</title>
      
      <meta http-equiv="pragma" content="no-cache">
      <meta http-equiv="cache-control" content="no-cache">
      <meta http-equiv="expires" content="0">  
      <meta http-equiv="keywords" content="keyword1,keyword2,keyword3">
      <meta http-equiv="description" content="This is my page">
      <link rel="stylesheet" href="css/bootstrap.min.css">
      
      
    </head>
    
    <body>
        <section class="hj-second-page-section">
          <div class="container-fluid">
            <div class="rows">
              <div class="col-xs-12 col-sm-12 col-md-12 col-lg-12">
                <div class="rows">
                  <div class="col-xs-12 col-sm-12 col-md-12 col-lg-12 hj-jumbotron-div">
                    <div class="panel panel-primary ng-scope">
                     
                     <!-- pannel start -->
                     <div class="panel-body vc-pannel-body-toggle">
                         <div class="rows ng-scope">
                           <div class="panel-body vc-msg-panel-body">
                             <div class="row">
                              
                              <div class="col-xs-12 col-sm-12 col-md-6 col-lg-6">
                                 <div id="rt_chart1" style=""></div>
                              </div>
                              
                             </div>
                          </div>
                         </div>
                         
                     </div>
                    
                     <!-- pannel end -->
                    </div>
                  </div>
                </div>
              </div>
            </div>
          </div>
        </section>
          
        
        <script src="js/echarts2.js"></script>
        <script src="js/jquery-2.2.3.min.js"></script>
        
        <script>
          /**
           * @description 绘制柱状图
           * @date 2019-11-13
           * @param 
           */
          function initChart1() {
            $("#rt_chart1").height(460);
            $("#rt_chart1").width(1205);
            $("#rt_chart1").css("border","1px solid #ddd");
            var myChart1 = echarts.init(document.getElementById("rt_chart1"));
    
            //var option1 = {
                var  option1 = {
                        title : {
                            text: '阿里历年双十一销售数据统计及预测',
                            //subtext: '数据来源于网络',
                            left: 'center'
                        },
                        color: ['#DB4B4B'],
                        tooltip : {
                            trigger: 'axis',
                            axisPointer : {            // 坐标轴指示器,坐标轴触发有效
                                type : 'shadow'        // 默认为直线,可选为:'line' | 'shadow'
                            }
                        },
                        grid: {
                            left: '3%',
                            right: '4%',
                            bottom: '3%',
                            containLabel: true
                        },
                        xAxis : [
                            {
                                type : 'category',
                                data:[2009,2010,2011,2012,2013,2014,2015,2016,2017,2018,2019,2020],
                                axisTick: {
                                    alignWithLabel: true
                                },
                                axisLabel: {
                                    interval:0 
                                }
                            }
                        ],
                        yAxis : [
                            {
                                type : 'value'
                            }
                        ],
                        series : [
                            {
                                itemStyle: {
                                         normal: {
                                             label: {
                                                 show: true,
                                                 position: 'top',
                                                 textStyle: {
                                                     color: '#0099ff'
                                                 }
                                             }
                                        }
                                   },
                                name:'亿元',
                                type:'bar',
                                barWidth: '60%',
                                data:[0.5,9.36,52.0,191.0,350.0,571.0,912.0,1207.0,1682.0,2135.0,2684.0,3036.0]
                            }
                        ]
                    };


            // 为echarts对象加载数据
            myChart1.setOption(option1);
          }
    
          initChart1();
        </script>
    </body>
    </html>

  • 相关阅读:
    zookeeper简介
    LRU和LFU的区别和使用场景
    windows环境搭建Webpack5 + Vue3项目实践
    Javascript 导出文件(post、get请求)
    解决Nginx出现403 forbidden (13: Permission denied)报错的四种方法
    2021 ASP.NET Core 开发者路线图
    华为云云原生王者之路钻石集训营--学习笔记
    Kubernetes全栈架构师(资源调度上)--学习笔记
    Kubernetes全栈架构师(基本概念)--学习笔记
    Kubernetes全栈架构师(Docker基础)--学习笔记
  • 原文地址:https://www.cnblogs.com/herd/p/11848042.html
Copyright © 2011-2022 走看看