matlab scatter3函数
Syntax
scatter3(X,Y,Z)
scatter3(X,Y,Z,S)
scatter3(X,Y,Z,S,C)
scatter3(___,'filled')
scatter3(___,markertype)
scatter3(___,Name,Value)
scatter3(ax,___)
h = scatter3(___)
Description
scatter3( displays circles at the locations specified by the vectors X,Y,Z)X, Y, and Z.
scatter3( draws each circle with the size specified by X,Y,Z,S)S. To plot each circle with equal size, specify S as a scalar. To plot each circle with a specific size, specify S as a vector.
scatter3( draws each circle with the color specified by X,Y,Z,S,C)C.
-
If
Cis a character vector of a color name or an RGB triplet, then all circles are plotted with the specified color. -
If
Cis a three column matrix with the number of rows inCequal to the length ofX,Y, andZ, then each row ofCspecifies an RGB color value for the corresponding circle. -
If
Cis a vector with length equal to the length ofX,Y, andZ, then the values inCare linearly mapped to the colors in the current colormap.
scatter3(___, fills in the circles, using any of the input argument combinations in the previous syntaxes.'filled')
scatter3(___, specifies the marker type.markertype)
scatter3(___, specifies scatter series properties using one or more Name,Value)Name,Value pair arguments.
scatter3( plots into the axes specified by ax,___)ax instead of into the current axes (gca). The ax option can precede any of the input argument combinations in the previous syntaxes.
h = scatter3(___)h to modify properties of the scatter series after it is created.
Examples
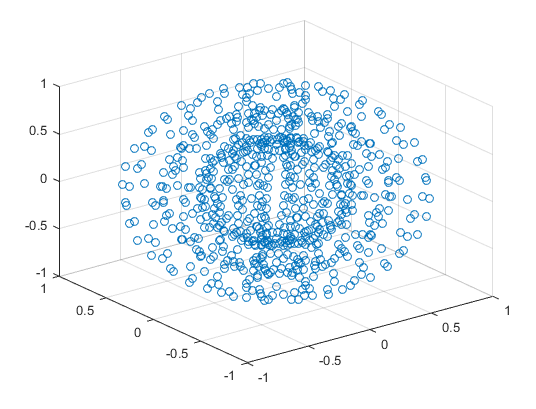
1、Create a 3-D scatter plot. Use sphere to define vectors x, y, and z.
figure
[X,Y,Z] = sphere(16);
x = [0.5*X(:); 0.75*X(:); X(:)];
y = [0.5*Y(:); 0.75*Y(:); Y(:)];
z = [0.5*Z(:); 0.75*Z(:); Z(:)];
scatter3(x,y,z)
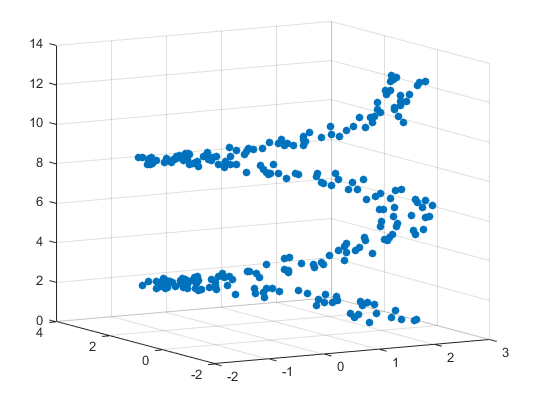
2、Fill in Markers
Create vectors x and y as cosine and sine values with random noise.
z = linspace(0,4*pi,250);
x = 2*cos(z) + rand(1,250);
y = 2*sin(z) + rand(1,250);
Create a 3-D scatter plot and fill in the markers. Use view to change the angle of the axes in the figure.
scatter3(x,y,z,'filled')
view(-30,10)
代码参考:matlab帮助手册