Qt echarts
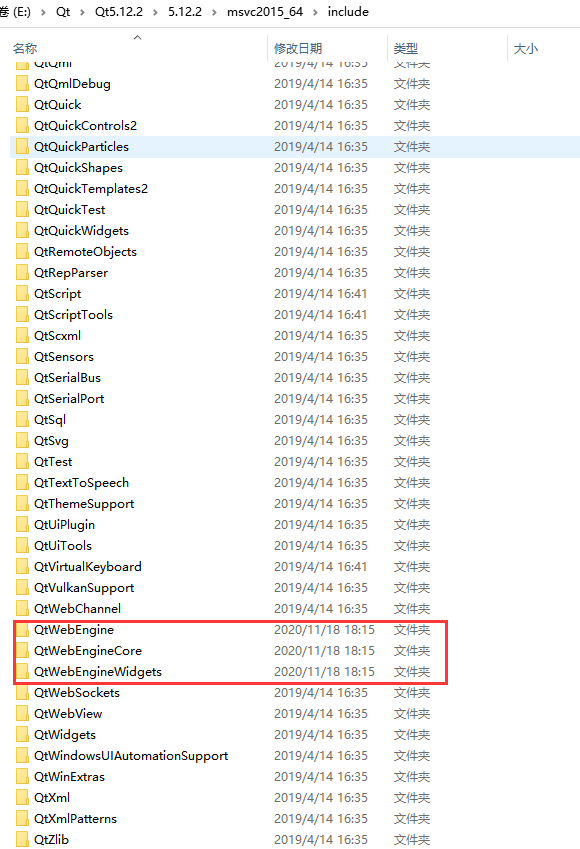
一定要注意,Qt的版本要在qt5.6及其以上,而且要注意自己的开发环境,(如果你用的vs2015开发,而且开发环境是msvc2015_64),好多版本msvc2015_64是没有QtWebEngine、QtWebEngineCore、QtWebEngineWidgets这几个库的,这几个库在msvc2017_64中存在,需要从msvc2017_64的bin、lib、include目录拷贝对应dll、lib和目录到msvc2015_64对应的目录下,这样才能正常使用QtWebEngine及其相关组件。
ui_qtechartstest.h
/********************************************************************************
** Form generated from reading UI file 'qtechartstest.ui'
**
** Created by: Qt User Interface Compiler version 5.12.2
**
** WARNING! All changes made in this file will be lost when recompiling UI file!
********************************************************************************/

#ifndef UI_QTECHARTSTEST_H
#define UI_QTECHARTSTEST_H

#include <QtCore/QVariant>
#include <QtWebEngineWidgets/QWebEngineView>
#include <QtWidgets/QAction>
#include <QtWidgets/QApplication>
#include <QtWidgets/QHBoxLayout>
#include <QtWidgets/QMainWindow>
#include <QtWidgets/QMenuBar>
#include <QtWidgets/QStatusBar>
#include <QtWidgets/QToolBar>
#include <QtWidgets/QVBoxLayout>
#include <QtWidgets/QWidget>

QT_BEGIN_NAMESPACE

class Ui_QtEchartsTestClass
{
public:
    QAction *actionEdit1;
    QWidget *centralWidget;
    QVBoxLayout *verticalLayout;
    QWidget *widget;
    QHBoxLayout *horizontalLayout;
    QWebEngineView *webEngineView;
    QMenuBar *menuBar;
    QToolBar *mainToolBar;
    QStatusBar *statusBar;

    void setupUi(QMainWindow *QtEchartsTestClass)
    {
        if (QtEchartsTestClass->objectName().isEmpty())
            QtEchartsTestClass->setObjectName(QString::fromUtf8("QtEchartsTestClass"));
        QtEchartsTestClass->resize(836, 638);
        actionEdit1 = new QAction(QtEchartsTestClass);
        actionEdit1->setObjectName(QString::fromUtf8("actionEdit1"));

        centralWidget = new QWidget(QtEchartsTestClass);
        centralWidget->setObjectName(QString::fromUtf8("centralWidget"));
        verticalLayout = new QVBoxLayout(centralWidget);
        verticalLayout->setSpacing(6);
        verticalLayout->setContentsMargins(11, 11, 11, 11);
        verticalLayout->setObjectName(QString::fromUtf8("verticalLayout"));
        widget = new QWidget(centralWidget);
        widget->setObjectName(QString::fromUtf8("widget"));
        widget->setMinimumSize(QSize(200, 160));
        horizontalLayout = new QHBoxLayout(widget);
        horizontalLayout->setSpacing(6);
        horizontalLayout->setContentsMargins(11, 11, 11, 11);
        horizontalLayout->setObjectName(QString::fromUtf8("horizontalLayout"));
        webEngineView = new QWebEngineView(widget);
        webEngineView->setObjectName(QString::fromUtf8("webEngineView"));
        webEngineView->setUrl(QUrl(QString::fromUtf8("about:blank")));

        horizontalLayout->addWidget(webEngineView);


        verticalLayout->addWidget(widget);

        QtEchartsTestClass->setCentralWidget(centralWidget);
        menuBar = new QMenuBar(QtEchartsTestClass);
        menuBar->setObjectName(QString::fromUtf8("menuBar"));
        menuBar->setGeometry(QRect(0, 0, 836, 23));
        QtEchartsTestClass->setMenuBar(menuBar);
        mainToolBar = new QToolBar(QtEchartsTestClass);
        mainToolBar->setObjectName(QString::fromUtf8("mainToolBar"));
        QtEchartsTestClass->addToolBar(Qt::TopToolBarArea, mainToolBar);
        statusBar = new QStatusBar(QtEchartsTestClass);
        statusBar->setObjectName(QString::fromUtf8("statusBar"));
        QtEchartsTestClass->setStatusBar(statusBar);

        mainToolBar->addAction(actionEdit1);


        retranslateUi(QtEchartsTestClass);

        QMetaObject::connectSlotsByName(QtEchartsTestClass);
    } // setupUi

    void retranslateUi(QMainWindow *QtEchartsTestClass)
    {
        QtEchartsTestClass->setWindowTitle(QApplication::translate("QtEchartsTestClass", "QtEchartsTest", nullptr));
        actionEdit1->setText(QApplication::translate("QtEchartsTestClass", "344277256346224271", nullptr));

    } // retranslateUi

};

namespace Ui {
    class QtEchartsTestClass: public Ui_QtEchartsTestClass {};
} // namespace Ui

QT_END_NAMESPACE

#endif // UI_QTECHARTSTEST_H
qtechartstest.h
#ifndef QTECHARTSTEST_H
#define QTECHARTSTEST_H

#include <QtWidgets/QMainWindow>
#include <QUrl>
#include <QFile>
#include <QIODevice>
#include <QByteArray>
#include <QDir>
#include <QWebEngineProfile>
#include <QtWebChannel/QWebChannel>

#include <QCoreApplication>
#include <QDebug>

#include "ui_qtechartstest.h"

class QtEchartsTest : public QMainWindow
{
    Q_OBJECT

public:
    QtEchartsTest(QWidget *parent = 0);
    ~QtEchartsTest();

    void loadBar1();


public slots:
    void editName1();


private:
    Ui::QtEchartsTestClass ui;
};

#endif // QTECHARTSTEST_H
qtechartstest.cpp
#include "qtechartstest.h"

QtEchartsTest::QtEchartsTest(QWidget *parent)
    : QMainWindow(parent)
{
    ui.setupUi(this);

    connect(ui.actionEdit1, SIGNAL(triggered()), this, SLOT(editName1()));

    loadBar1();

}

QtEchartsTest::~QtEchartsTest()
{

}


void QtEchartsTest::loadBar1()
{
    QString htmlPath = "" + qApp->applicationDirPath() + "/html/bar2.html";

    qDebug() << "======================" << htmlPath;

    ui.webEngineView->load(QUrl(htmlPath));
}

void QtEchartsTest::editName1()
{
    //ui.webEngineView->page()->runJavaScript(QString("changeName();"));
}
bar2.html
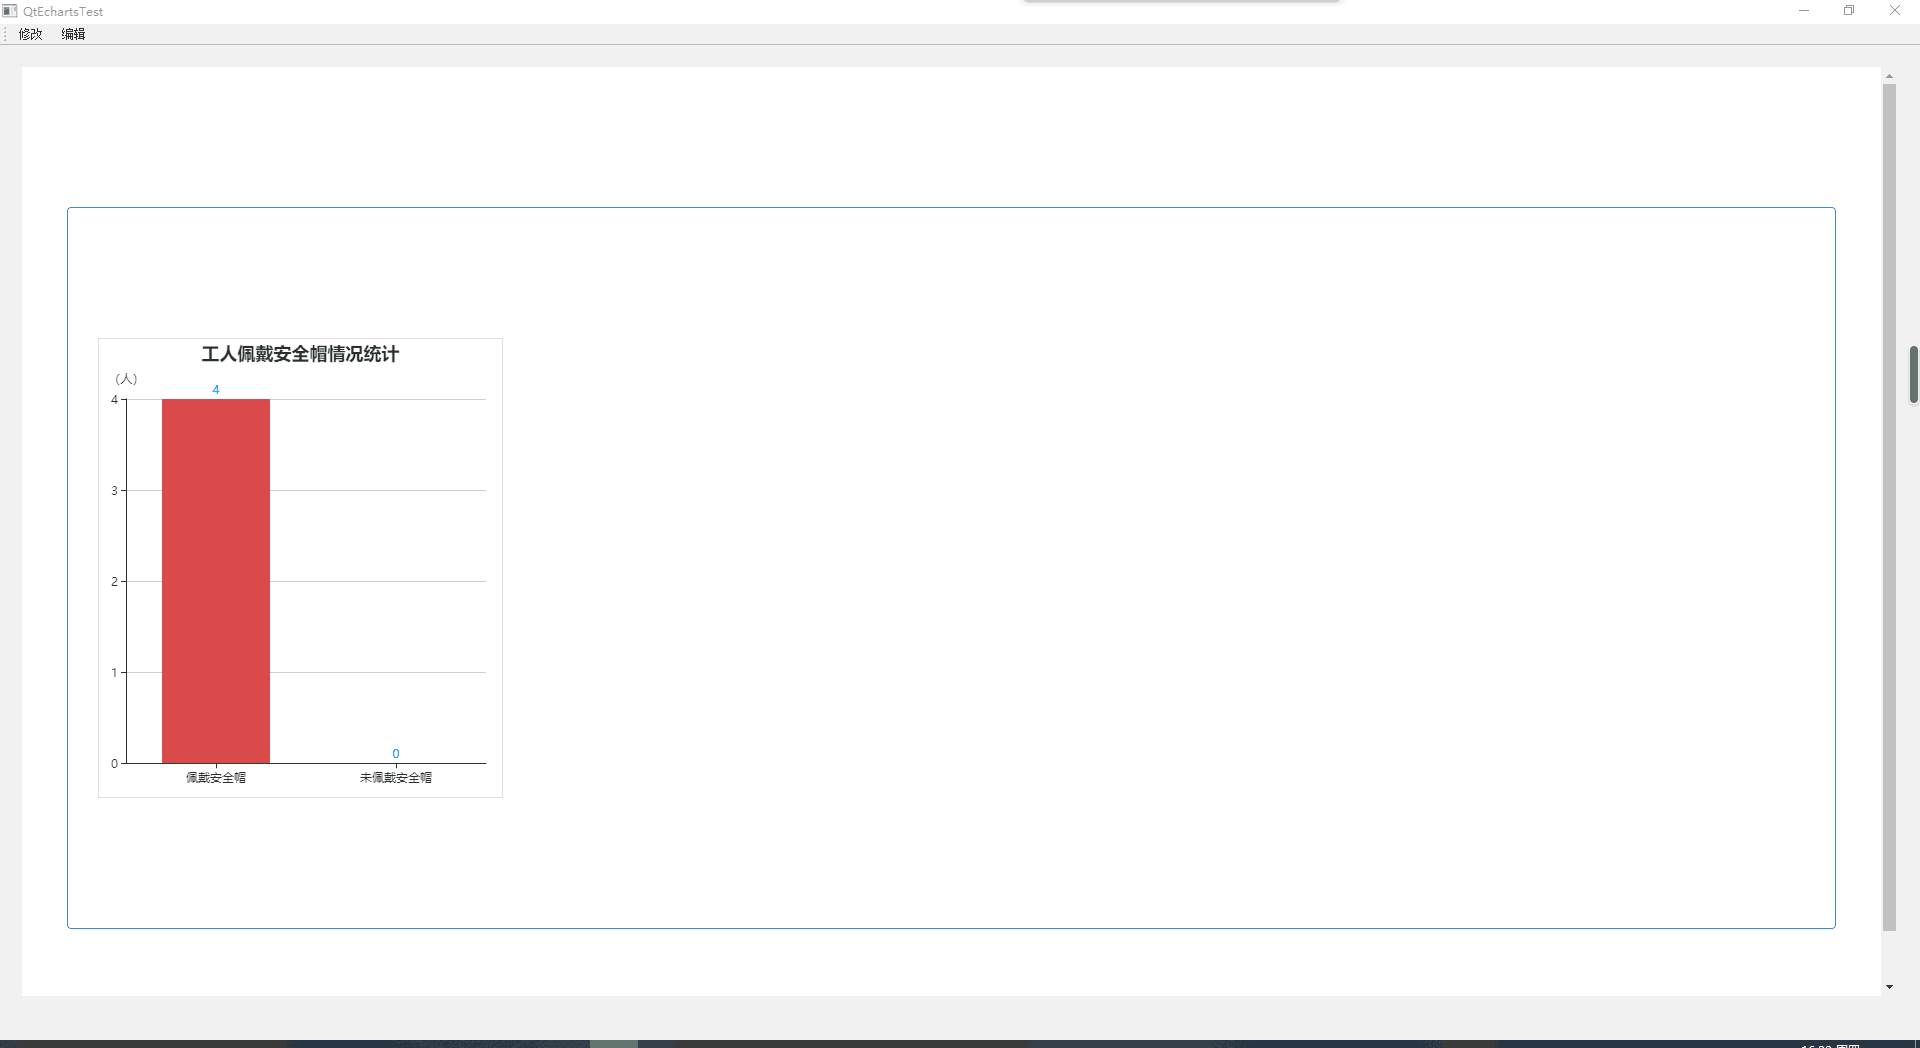
<!DOCTYPE html>
<html>
  <head>
  <title></title>

  <meta http-equiv="pragma" content="no-cache">
  <meta http-equiv="cache-control" content="no-cache">
  <meta http-equiv="expires" content="0">
  <meta http-equiv="keywords" content="keyword1,keyword2,keyword3">
  <meta http-equiv="description" content="This is my page">
  <link rel="stylesheet" href="css/bootstrap.min.css">


</head>

<body>
    <section class="hj-second-page-section">
      <div class="container-fluid">
        <div class="rows">
          <div class="col-xs-12 col-sm-12 col-md-12 col-lg-12">
            <div class="rows">
              <div class="col-xs-12 col-sm-12 col-md-12 col-lg-12 hj-jumbotron-div">
                <div class="panel panel-primary ng-scope">

                 <!-- pannel start -->
                 <div class="panel-body vc-pannel-body-toggle">
                     <div class="rows ng-scope">
                       <div class="panel-body vc-msg-panel-body">
                         <div class="row">

                          <div class="col-xs-12 col-sm-12 col-md-12 col-lg-12">
                             <div id="rt_chart1" style=""></div>
                          </div>

                         </div>
                      </div>
                     </div>

                 </div>

                 <!-- pannel end -->
                </div>
              </div>
            </div>
          </div>
        </div>
      </div>
    </section>


    <script src="js/echarts-all.js"></script>
    <script src="js/jquery-2.2.3.min.js"></script>

    <script>
      /**
       * @description 绘制柱状图
       * @date 2020-11-18
       * @param
       */
      function initChart1() {
        $("#rt_chart1").height(460);
        $("#rt_chart1").width(405);
        $("#rt_chart1").css("border","1px solid #ddd");
        var myChart1 = echarts.init(document.getElementById("rt_chart1"));

        //var option1 = {
            var  option1 = {
                    title : {
                        text: '',
                        //subtext: '',
                        left: 'center'
                    },
                    color: ['#DB4B4B'],
                    tooltip : {
                        trigger: 'axis',
                        axisPointer : {            // 坐标轴指示器,坐标轴触发有效
                            type : 'shadow'        // 默认为直线,可选为:'line' | 'shadow'
                        }
                    },
                    grid: {
                        left: '3%',
                        right: '4%',
                        bottom: '3%',
                        containLabel: true
                    },
                    xAxis : [
                        {
                            type : 'category',
                            data:['佩戴安全帽','未佩戴安全帽'],
                            axisTick: {
                                alignWithLabel: true
                            },
                            axisLabel: {
                                interval:0
                            }
                        }
                    ],
                    yAxis : [
                        {
                            name:'(人)',
                            type : 'value'
                        }
                    ],
                    series : [
                        {
                            itemStyle: {
                                     normal: {
                                         label: {
                                             show: true,
                                             position: 'top',
                                             textStyle: {
                                                 color: '#0099ff'
                                             }
                                         }
                                    }
                               },
                            name:'人',
                            type:'bar',
                            barWidth: '60%',
                            data:[4,0]
                        }
                    ]
                };


        // 为echarts对象加载数据
        myChart1.setOption(option1);
      }

      initChart1();
    </script>
</body>
</html>