ELK报错及解决方案
1.jdk版本问题
报错如下:
future versions of Elasticsearch will require Java 11; your Java version from [/usr/local/jdk9/jdk-9.0.4] does not meet this requirement
Java HotSpot(TM) 64-Bit Server VM warning: Option UseConcMarkSweepGC was deprecated in version 9.0 and will likely be removed in a future release.
解决方案:
由于Elasticsearch依赖于jdk,es和jdk有着对应的依赖关系。具体可见:
https://www.elastic.co/cn/support/matrix
https://www.elastic.co/guide/en/elasticsearch/reference/7.2/setup.html
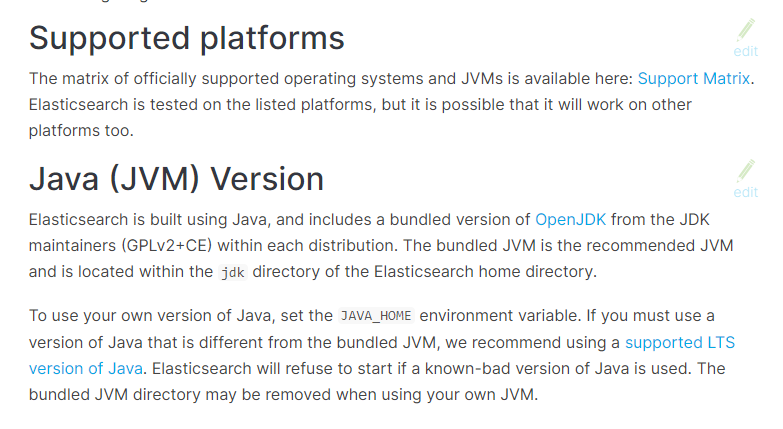
这里是说Elasticsearch该版本内置了JDK,而内置的JDK是当前推荐的JDK版本。当然如果你本地配置了JAVA_HOME那么ES就是优先使用配置的JDK启动ES。
ES推荐使用LTS版本的JDK(这里只是推荐,JDK8就不支持),如果你使用了一些不支持的JDK版本,ES会拒绝启动。
ES推荐使用LTS版本的JDK(这里只是推荐,JDK8就不支持),如果你使用了一些不支持的JDK版本,ES会拒绝启动。
根据启动信息我们看到Elasticsearch7.2推荐使用JDK11
jdk下载链接:https://www.oracle.com/technetwork/java/java-se-support-roadmap.html
安装OpenJDK11
[root@ELK1 tar.gz]# pwd
/usr/local/src/tar.gz

#下载
[root@ELK1 tar.gz]# wget https://download.java.net/java/GA/jdk11/13/GPL/openjdk-11.0.1_linux-x64_bin.tar.gz

#加压到指定目录
[root@ELK1 tar.gz]# tar -xzvf jdk-11.0.4_linux-x64_bin.tar.gz /opt/
修改配置文件
[root@localhost bin]# vim /home/elk/elasticsearch/-7.2.1/bin/elasticsearch

#配置自己的jdk11
export JAVA_HOME=/opt/jdk-11.0.1
export PATH=$JAVA_HOME/bin:$PATH

#添加jdk判断
if [ -x "$JAVA_HOME/bin/java" ]; then
        JAVA="/opt/jdk-11.0.1/bin/java"
else
        JAVA=`which java`
fi
启动ES
[elasticsearch@ELK1 bin]$ ./elasticsearch
OpenJDK 64-Bit Server VM warning: Option UseConcMarkSweepGC was deprecated in version 9.0 and will likely be removed in a future release.
[2019-08-02T15:33:27,994][INFO ][o.e.e.NodeEnvironment    ] [node-1] using [1] data paths, mounts [[/ (rootfs)]], net usable_space [32.6gb], net total_space [35.7gb], types [rootfs]
[2019-08-02T15:33:28,014][INFO ][o.e.e.NodeEnvironment    ] [node-1] heap size [1015.6mb], compressed ordinary object pointers [true]
[2019-08-02T15:33:28,017][INFO ][o.e.n.Node               ] [node-1] node name [node-1], node ID [8zGCWQhBS3OpVShqjSgU-w], cluster name [es-application]
[2019-08-02T15:33:28,017][INFO ][o.e.n.Node               ] [node-1] version[7.2.0], pid[1545], build[default/tar/508c38a/2019-06-20T15:54:18.811730Z], OS[Linux/3.10.0-862.el7.x86_64/amd64], JVM[Oracle Corporation/OpenJDK 64-Bit Server VM/11.0.1/11.0.1+13]
[2019-08-02T15:33:28,017][INFO ][o.e.n.Node               ] [node-1] JVM home [/opt/jdk-11.0.1]
[2019-08-02T15:33:28,018][INFO ][o.e.n.Node               ] [node-1] JVM arguments [-Xms1g, -Xmx1g, -XX:+UseConcMarkSweepGC, -XX:CMSInitiatingOccupancyFraction=75, -XX:+UseCMSInitiatingOccupancyOnly, -Des.networkaddress.cache.ttl=60, -Des.networkaddress.cache.negative.ttl=10, -XX:+AlwaysPreTouch, -Xss1m, -Djava.awt.headless=true, -Dfile.encoding=UTF-8, -Djna.nosys=true, -XX:-OmitStackTraceInFastThrow, -Dio.netty.noUnsafe=true, -Dio.netty.noKeySetOptimization=true, -Dio.netty.recycler.maxCapacityPerThread=0, -Dlog4j.shutdownHookEnabled=false, -Dlog4j2.disable.jmx=true, -Djava.io.tmpdir=/tmp/elasticsearch-5247006010869253587, -XX:+HeapDumpOnOutOfMemoryError, -XX:HeapDumpPath=data, -XX:ErrorFile=logs/hs_err_pid%p.log, -Xlog:gc*,gc+age=trace,safepoint:file=logs/gc.log:utctime,pid,tags:filecount=32,filesize=64m, -Djava.locale.providers=COMPAT, -Dio.netty.allocator.type=unpooled, -XX:MaxDirectMemorySize=536870912, -Des.path.home=/usr/local/src/elasticsearch, -Des.path.conf=/usr/local/src/elasticsearch/config, -Des.distribution.flavor=default, -Des.distribution.type=tar, -Des.bundled_jdk=true]
2.启动elasticsearch报错
报错如下:
ERROR: [2] bootstrap checks failed
[1]: max file descriptors [4096] for elasticsearch process is too low, increase to at least [65535]
[2]: max virtual memory areas vm.max_map_count [65530] is too low, increase to at least [262144]
[2019-08-08T16:04:33,578][INFO ][o.e.n.Node               ] [ELK1] stopping ...
[2019-08-08T16:04:33,591][INFO ][o.e.n.Node               ] [ELK1] stopped
[2019-08-08T16:04:33,592][INFO ][o.e.n.Node               ] [ELK1] closing ...
[2019-08-08T16:04:33,618][INFO ][o.e.n.Node               ] [ELK1] closed
[2019-08-08T16:04:33,621][INFO ][o.e.x.m.p.NativeController] [ELK1] Native controller process has stopped - no new native processes can be started
解决方法:
#1、max file descriptors [4096] for elasticsearch process is too low, increase to at least [65536]
每个进程最大同时打开文件数太小,可通过下面2个命令查看当前数量
ulimit -Hn
ulimit -Sn

修改/etc/security/limits.conf文件,增加配置,用户退出后重新登录生效

*               soft    nofile          65536
*               hard    nofile          65536
#2、max number of threads [3818] for user [es] is too low, increase to at least [4096]
#问题同上,最大线程个数太低。修改配置文件/etc/security/limits.conf,增加配置

*               soft    nproc           4096
*               hard    nproc           4096

#可通过命令查看

ulimit -Hu
ulimit -Su
3.在安装elasticsearch-head的过程中npm install报错
报错如下:
[root@ELK1 elasticsearch-head]# npm install
npm: relocation error: npm: symbol SSL_set_cert_cb, version libssl.so.10 not defined in file libssl.so.10 with link time reference
解决方法:
升级openssl,执行:
yum update openssl -y

#升级之前版本信息:

[root@ELK1 elasticsearch-head]# openssl version
OpenSSL 1.0.1i 6 Aug 2014

#升级之后:

[root@ELK elasticsearch-head]# openssl version
OpenSSL 1.0.2k-fips 26 Jan 2017

此时再次执行,报错消除
4.启动logstash报错
报错如下:
Thread.exclusive is deprecated, use Thread::Mutex
Sending Logstash logs to /data/logstash/logs which is now configured via log4j2.properties
[2019-08-08T17:23:59,508][WARN ][logstash.config.source.multilocal] Ignoring the 'pipelines.yml' file because modules or command line options are specified
[2019-08-08T17:23:59,519][FATAL][logstash.runner          ] Logstash could not be started because there is already another instance using the configured data directory.  If you wish to run multiple instances, you must change the "path.data" setting.
[2019-08-08T17:23:59,527][ERROR][org.logstash.Logstash    ] java.lang.IllegalStateException: Logstash stopped processing because of an error: (SystemExit) exit
原因:之前运行的instance有缓冲,保存在path.data里面有.lock文件,删除掉就可以
解决方法:
在 logstash.yml 文件中找到 Data path 的路径(默认在安装目录的data目录下)
# ------------ Data path ------------------
#
# Which directory should be used by logstash and its plugins
# for any persistent needs. Defaults to LOGSTASH_HOME/data
#
path.data:
查看是否存在 .lock 文件,如果存在把它删除
[root@ELK1 data]# ls -alh
总用量 20K
drwxr-sr-x  4 tingshuo staff 4.0K 8月 19 11:42 .
drwxr-sr-x 14 tingshuo staff 4.0K 8月 19 11:42 ..
drwxr-sr-x  2 tingshuo staff 4.0K 8月 19 11:42 dead_letter_queue
-rw-r--r--  1 tingshuo staff    0 8月 19 11:42 .lock
drwxr-sr-x  2 tingshuo staff 4.0K 8月 19 11:42 queue
-rw-r--r--  1 tingshuo staff   36 8月 19 11:42 uuid
删除
[root@ELK1 data]# rm .lock
5.Logstash 报错: A plugin had an unrecoverable error. Will restart this plugin
解决方法:
因为断开终端,进程还存在
[root@Elk1 ~]# ps aux | grep logstash
root     12180  1.6  4.5 6912300 744896 ?      Sl   Oct18  69:39 /usr/bin/java -XX:+UseParNewGC -XX:+UseConcMarkSweepGC -Djava.awt.headless=true -XX:CMSInitiatingOccupancyFraction=75 -XX:+UseCMSInitiatingOccupancyOnly -XX:+HeapDumpOnOutOfMemoryError -Xmx1g -Xss2048k -Djffi.boot.library.path=/opt/logstash/vendor/jruby/lib/jni -XX:+UseParNewGC -XX:+UseConcMarkSweepGC -Djava.awt.headless=true -XX:CMSInitiatingOccupancyFraction=75 -XX:+UseCMSInitiatingOccupancyOnly -XX:+HeapDumpOnOutOfMemoryError -XX:HeapDumpPath=/opt/logstash/heapdump.hprof -Xbootclasspath/a:/opt/logstash/vendor/jruby/lib/jruby.jar -classpath : -Djruby.home=/opt/logstash/vendor/jruby -Djruby.lib=/opt/logstash/vendor/jruby/lib -Djruby.script=jruby -Djruby.shell=/bin/sh org.jruby.Main --1.9 /opt/logstash/lib/bootstrap/environment.rb logstash/runner.rb agent -f /etc/logstash/conf.d/filebeat.conf
root     16921  0.0  0.0 103244   864 pts/2    S+   15:28   0:00 grep 12180
[root@Elk1 ~]# kill 12180
杀掉这个没有正常关闭的前台测试 Logstash 进程,重启logstash。