结构:
/www
|
|-- /static
| |
| |-- echarts.js(当然还有echarts原dist目录下的文件(夹))
|
|-- /templates
| |
| |-- index.html
|
|-- app.py
|
|-- create_db.py
一、先准备数据
# create_db.py
# 只运行一次!!!

import sqlite3

# 连接
conn = sqlite3.connect('mydb.db')
c = conn.cursor()

# 创建表
c.execute('''DROP TABLE IF EXISTS weather''')
c.execute('''CREATE TABLE weather (month text, evaporation text, precipitation text)''')

# 数据
# 格式:月份,蒸发量,降水量
purchases = [('1月', 2, 2.6),
             ('2月', 4.9, 5.9),
             ('3月', 7, 9),
             ('4月', 23.2, 26.4),
             ('5月', 25.6, 28.7),
             ('6月', 76.7, 70.7),
             ('7月', 135.6, 175.6),
             ('8月', 162.2, 182.2),
             ('9月', 32.6, 48.7),
             ('10月', 20, 18.8),
             ('11月', 6.4, 6),
             ('12月', 3.3, 2.3)
            ]

# 插入数据
c.executemany('INSERT INTO weather VALUES (?,?,?)', purchases)

# 提交!!!
conn.commit()

# 查询方式一
for row in c.execute('SELECT * FROM weather'):
    print(row)


# 查询方式二
c.execute('SELECT * FROM weather')
print(c.fetchall())


# 查询方式二_2
res = c.execute('SELECT * FROM weather')
print(res.fetchall())


# 关闭
conn.close()
二、定义路由
定义了两个路由:'/'和'/weather',后一个用于处理ajax,返回json格式。形如:
{month:['1月','2月',...],evaporation:[3.1, 4, 4.6, ...],precipitation:[...]}
# app.py

import sqlite3
from flask import Flask, request, render_template, jsonify

app = Flask(__name__)


def get_db():
    db = sqlite3.connect('mydb.db')
    db.row_factory = sqlite3.Row
    return db


def query_db(query, args=(), one=False):
    db = get_db()
    cur = db.execute(query, args)
    db.commit()
    rv = cur.fetchall()
    db.close()
    return (rv[0] if rv else None) if one else rv


@app.route("/", methods=["GET"])
def index():
    return render_template("index.html")


@app.route("/weather", methods=["POST"])
def weather():
    if request.method == "POST":
        res = query_db("SELECT * FROM weather")

    return jsonify(month = [x[0] for x in res],
                   evaporation = [x[1] for x in res],
                   precipitation = [x[2] for x in res])


if __name__ == "__main__":
  app.run(debug=True)
三、使用echarts
这里使用单文件导入模式,见官网例子。
值得注意的是导入echarts.js时使用了url_for函数。初时,我使用了src="js/echarts.js",老是导入不了!原因不详!
index.html文件如下:
<!DOCTYPE html>
<html lang="en">
<head>
    <meta charset="utf-8">
    <title>ECharts Ajax</title>
    <script type="text/javascript" src="http://libs.baidu.com/jquery/1.11.1/jquery.min.js"></script>
</head>

<body>
    <!--Step:1 为ECharts准备一个具备大小(宽高)的Dom-->
    <div id="main" style="height:500px;border:1px solid #ccc;padding:10px;"></div>

    <!--Step:2 引入echarts.js-->
    <!--<script src="js/echarts.js"></script>-->
    <script src="{{ url_for('static', filename='echarts.js') }}"></script>

    <script type="text/javascript">
    // Step:3 为模块加载器配置echarts的路径,从当前页面链接到echarts.js,定义所需图表路径
    require.config({
        paths: {
            echarts: './static',
        }
    });

    // Step:4 动态加载echarts然后在回调函数中开始使用,注意保持按需加载结构定义图表路径
    require(
        [
            'echarts',
            'echarts/chart/bar', // 按需加载
            'echarts/chart/line',
        ],
        function (ec) {
            //--- 折柱 ---
            var myChart = ec.init(document.getElementById('main'));

            // 设置---------------------
            var option = {
                tooltip : {
                    trigger: 'axis'
                },
                legend: {
                    data:['蒸发量','降水量']
                },
                toolbox: {
                    show : true,
                    feature : {
                        mark : {show: true},
                        dataView : {show: true, readOnly: false},
                        magicType : {show: true, type: ['line', 'bar']},
                        restore : {show: true},
                        saveAsImage : {show: true}
                    }
                },
                calculable : true,
                xAxis : [
                    {
                        type : 'category',
                        data : []
                    }
                ],
                yAxis : [
                    {
                        type : 'value',
                        splitArea : {show : true}
                    }
                ],
                series : [
                    {
                        name:'蒸发量',
                        type:'bar',
                        data:[]
                    },
                    {
                        name:'降水量',
                        type:'line',
                        data:[]
                    }
                ]
            };

            $.ajax({
                cache: false,
                type: "POST",
                url: "/weather", //把表单数据发送到/weather
                data: null, // 发送的数据
                dataType : "json",  //返回数据形式为json
                async: false,
                error: function(request) {
                    alert("发送请求失败!");
                },
                success: function(result) {
                    //console.log(result);
                    for (i = 0, max = result.month.length; i < max; i++) { //注意:result.month.length
                        option.xAxis[0].data.push(result.month[i]);
                        option.series[0].data.push(parseFloat(result.evaporation[i]));
                        option.series[1].data.push(parseFloat(result.precipitation[i]));
                    };

                    // 为echarts对象加载数据--------------
                    myChart.setOption(option);
                }
            });
            // 为echarts对象加载数据--------------
            //myChart.setOption(option);
        }
    );
    </script>
</body>
</html>
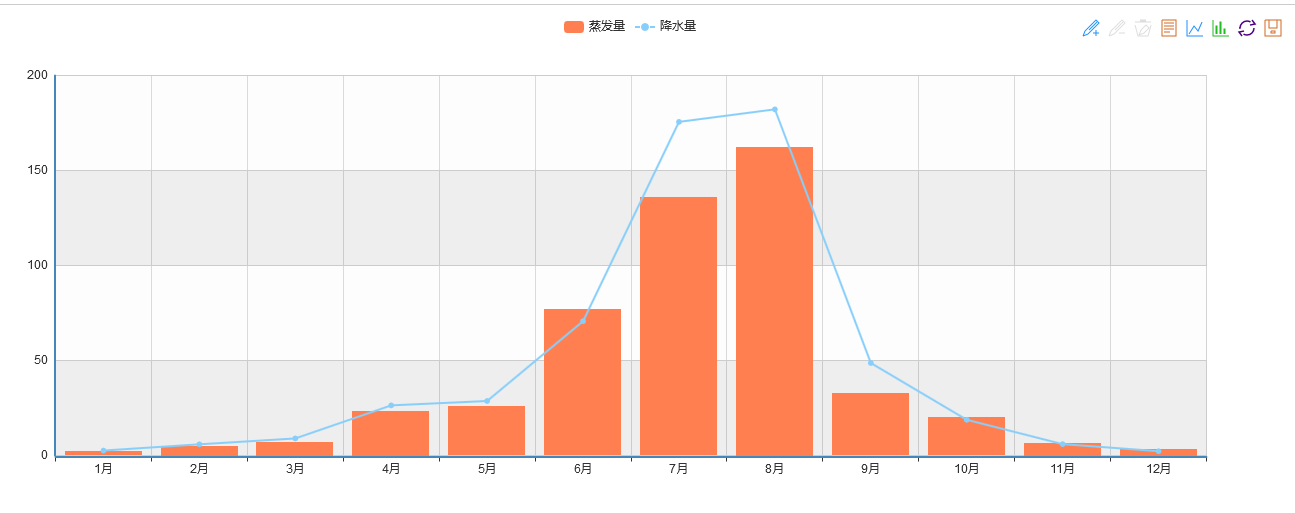
效果图