1、首先你得到echarts官网下载js,建议下载完整代码,这样你就很容易根据我的路径找到beijing.js
2、把echarts.js和beijingi.js根据你的路径引对,然后就可以copy我的代码咯
3、如果你需要改变地图的颜色或轮廓线的颜色,请参考我的第一篇文章 http://www.cnblogs.com/hhw3/p/6252677.html
4、如果需要其他地图可参考我的上一边文章 http://www.cnblogs.com/hhw3/p/7606917.html
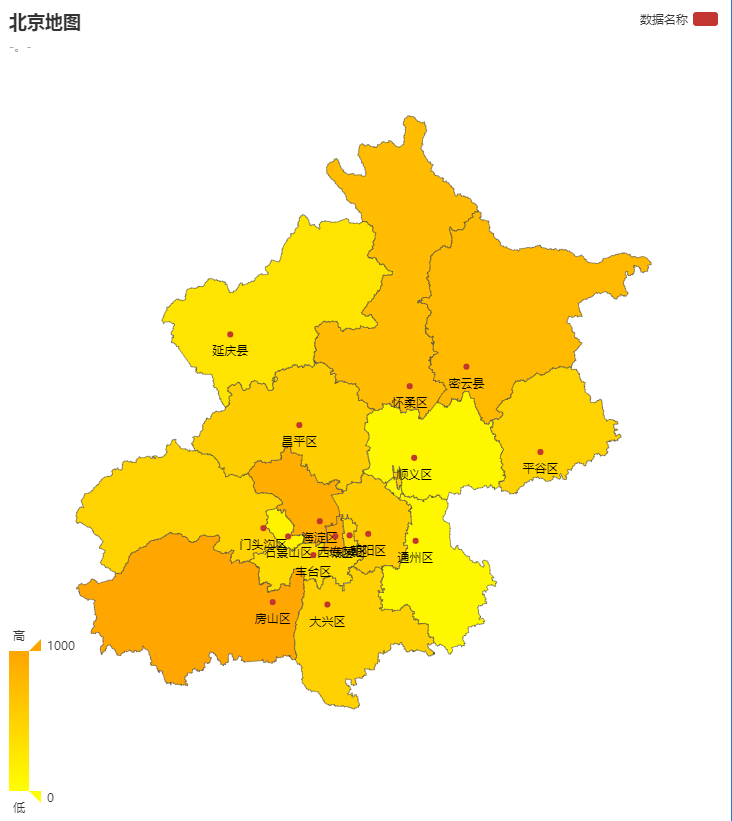
北京地图
<html>
<head>
<meta charset="utf-8">
<meta http-equiv="X-UA-Compatible" content="IE=edge">
</head>
<body>
    <div id="main" style="100%; height: 100%;"></div>
</body>
<script src="js/echarts.js"></script>
<script src="js/map/js/province/beijing.js"></script>
<script>
    var myChart = echarts.init(document.getElementById('main'));
    var option = {
        backgroundColor:['#ff0000'],
        title: {
            text : '北京地图',
            subtext : '-。-'
        },
        tooltip : {
            trigger: 'item',
            formatter: function(a){
                return a[2];
            }
        },
        legend: {
            orient: 'vertical',
            x:'right',
            data:['数据名称']
        },
        dataRange: {
            min: 0,
            max: 1000,
            color:['orange','yellow'],
            text:['高','低'],           // 文本,默认为数值文本
            calculable : true
        },
        series : [
            {
                name: '数据名称',
                type: 'map',
                mapType: '北京',
                selectedMode : 'single',
                itemStyle:{
                    normal:{label:{show:true}},
                    emphasis:{label:{show:true}}
                },
          //根据个人需要加,如果不需要则不必加
                data:[
                    {name: '怀柔区',value: Math.round(Math.random()*1000)},
                    {name: '延庆县',value: Math.round(Math.random()*1000)},
                    {name: '密云县',value: Math.round(Math.random()*1000)},
                    {name: '昌平区',value: Math.round(Math.random()*1000)},
                    {name: '平谷区',value: Math.round(Math.random()*1000)},
                    {name: '顺义区',value: Math.round(Math.random()*1000)},
                    {name: '门头沟区',value: Math.round(Math.random()*1000)},
                    {name: '海淀区',value: Math.round(Math.random()*1000)},
                    {name: '朝阳区',value: Math.round(Math.random()*1000)},
                    {name: '石景山区',value: Math.round(Math.random()*1000)},
                    {name: '西城区',value: Math.round(Math.random()*1000)},
                    {name: '东城区',value: Math.round(Math.random()*1000)},
                    {name: '宣武区',value: Math.round(Math.random()*1000)},
                    {name: '丰台区',value: Math.round(Math.random()*1000)},
                    {name: '房山区',value: Math.round(Math.random()*1000)},
                    {name: '通州区',value: Math.round(Math.random()*1000)},
                    {name: '大兴区',value: Math.round(Math.random()*1000)},

                ]
            }
        ]
    };
    myChart.setOption(option);
</script>
</html>
上海地图
(js引入就不强调了,照上面说的做就好)
<html>
<head>
<meta charset="utf-8">
<meta http-equiv="X-UA-Compatible" content="IE=edge">
</head>
<body>
    <div id="main" style="100%; height: 100%;"></div>
</body>
<script src="js/echarts.js"></script>
<script src="js/map/js/province/shanghai.js"></script>
<script>
    var myChart = echarts.init(document.getElementById('main'));
    var option = {
        title: {
            text : '上海地图',
            subtext : '-。-'
        },
        tooltip : {
            trigger: 'item',
            formatter: function(a){
                return a[2];
            }
        },
        legend: {
            orient: 'vertical',
            x:'right',
            data:['数据名称']
        },
        dataRange: {
            min: 0,
            max: 1000,
            color:['orange','yellow'],
            text:['高','低'],           // 文本,默认为数值文本
            calculable : true
        },
        series : [
            {
                name: '数据名称',
                type: 'map',
                mapType: '上海',
                selectedMode : 'single',
                itemStyle:{
                    normal:{label:{show:true}},
                    emphasis:{label:{show:true}}
                },
          //根据个人需要加,若不需要则不用加
                data:[
                    {name: '崇明县',value: Math.round(Math.random()*1000)},
                    {name: '宝山区',value: Math.round(Math.random()*1000)},
                    {name: '嘉定区',value: Math.round(Math.random()*1000)},
                    {name: '青浦区',value: Math.round(Math.random()*1000)},
                    {name: '杨浦区',value: Math.round(Math.random()*1000)},
                    {name: '虹口区',value: Math.round(Math.random()*1000)},
                    {name: '闸北区',value: Math.round(Math.random()*1000)},
                    {name: '普陀区',value: Math.round(Math.random()*1000)},
                    {name: '静安区',value: Math.round(Math.random()*1000)},
                    {name: '黄浦区',value: Math.round(Math.random()*1000)},
                    {name: '卢湾区',value: Math.round(Math.random()*1000)},
                    {name: '长宁区',value: Math.round(Math.random()*1000)},
                    {name: '徐汇区',value: Math.round(Math.random()*1000)},
                    {name: '浦东新区',value: Math.round(Math.random()*1000)},
                    {name: '松江区',value: Math.round(Math.random()*1000)},
                    {name: '闵行区',value: Math.round(Math.random()*1000)},
                    {name: '金山区',value: Math.round(Math.random()*1000)},
                    {name: '奉贤区',value: Math.round(Math.random()*1000)},
                    {name: '南汇区',value: Math.round(Math.random()*1000)}
                ]
            }
        ]
    };
    myChart.setOption(option);

</script>
</html>

如果我有帮助到你请点个赞鼓励一下我吧!
上述内容是参照echarts官网http://echarts.baidu.com/,若有侵权请联系,谢谢!
作者:BlancheWang
出处:http://www.cnblogs.com/hhw3
本文版权归作者和博客园共有,欢迎转载,但未经作者同意必须保留此段声明,且在文章页面明显位置给出原文连接。