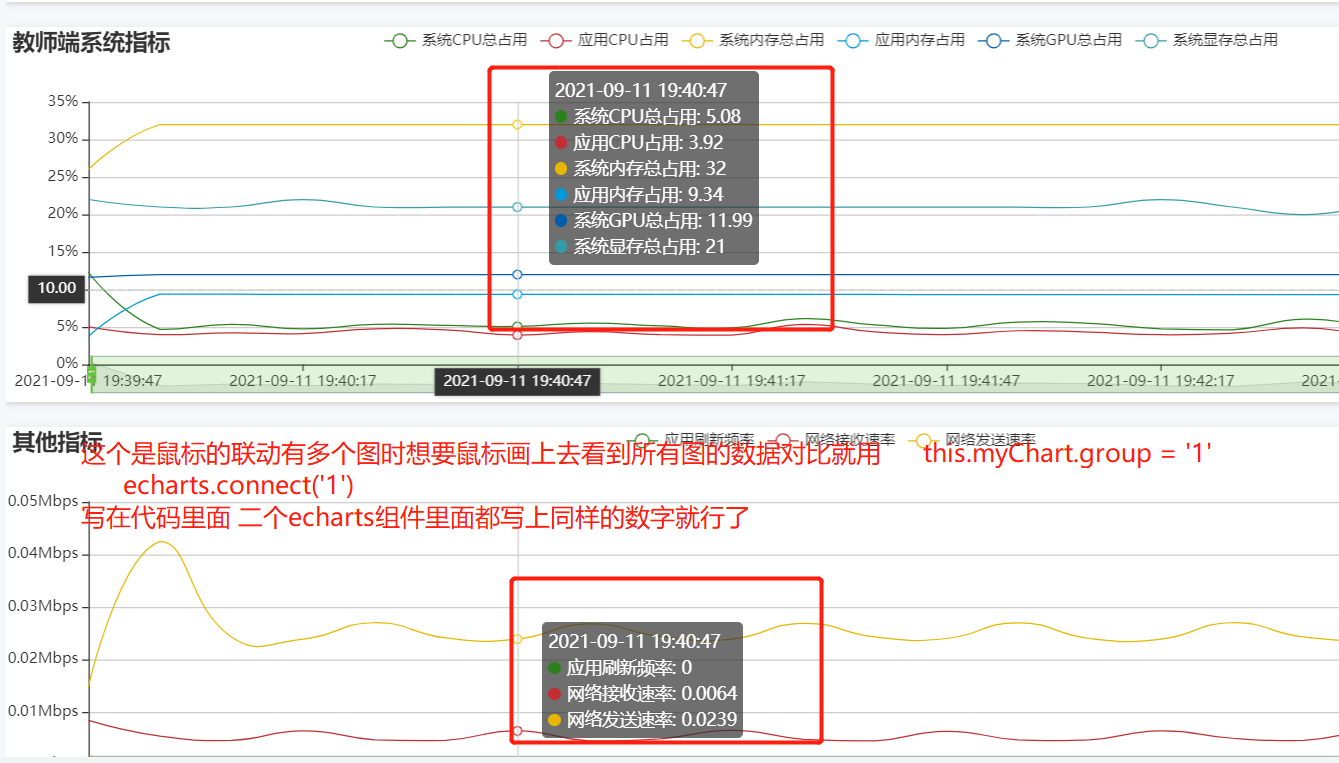
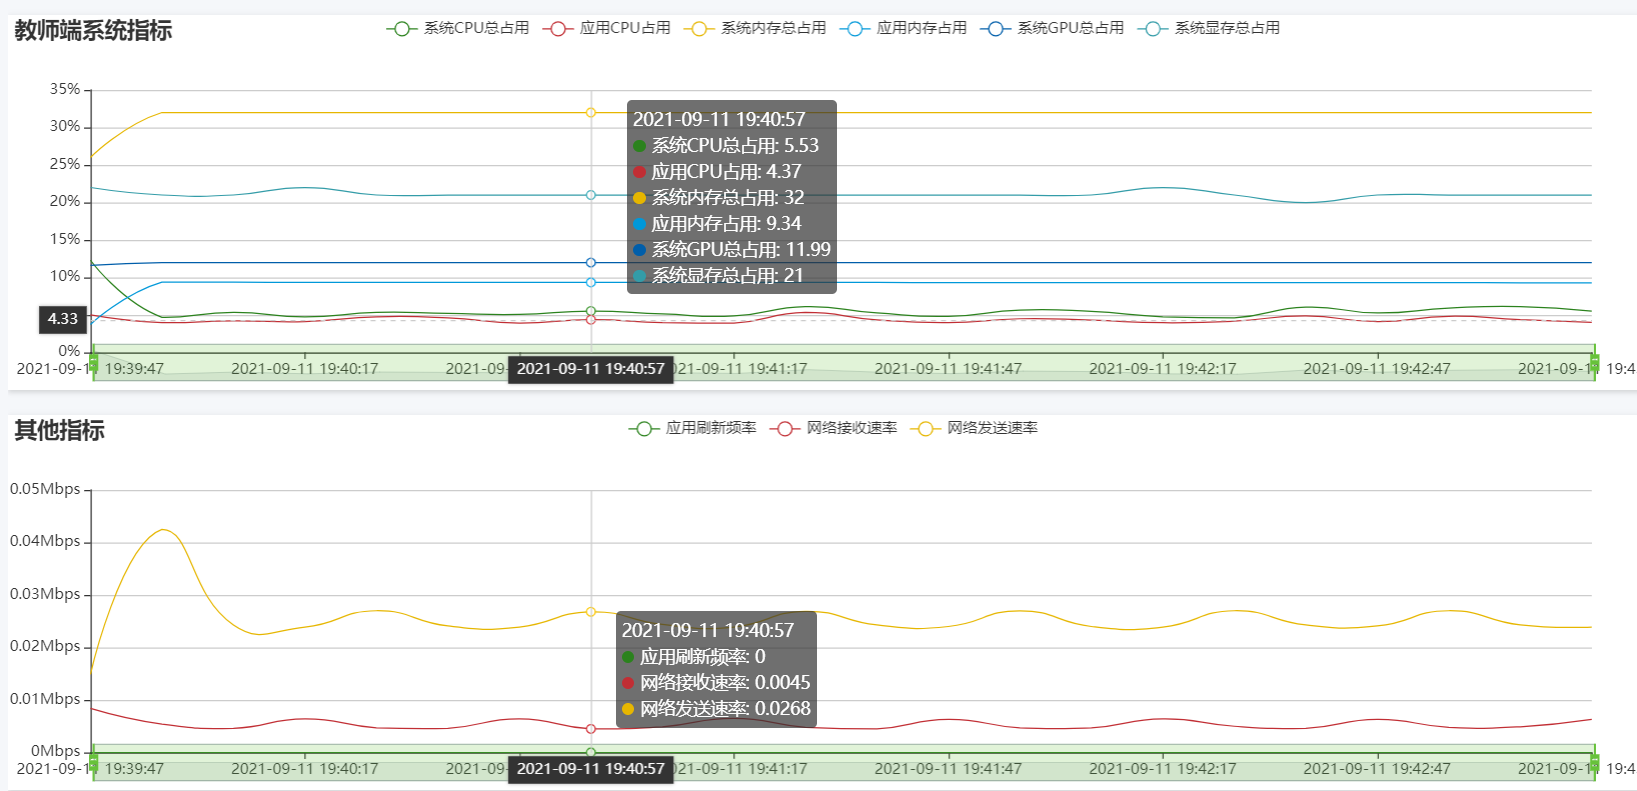
先给大家看图
父组件
<el-container v-show="abscissa">
<lineEchart
:CPUInfoList="CPUTotalUsage"
:Timer="Timer"
:abscissa="abscissa"
:ordinate="ordinate"
:title="title[0]"
:titleList="titleList[0]"
:unit="unit[0]"
></lineEchart>
</el-container>
components: {
lineEchart
  },
上面是DOM和组件注册
     CPUTotalUsage: '',
    Timer: '',
    abscissa: [],
       // 折线纵轴单位
      unit: ['%', 'Mbps'],
      // 折线title
      title: ['教师端系统指标', '其他指标', 'TOP5进程占用-CPU', 'TOP5进程占用-内存'],
    ordinate: [],
上面这些是data里面定义的数据 下面是请求到的数据
.then(res => {
if (res.Status == 1) {
this.dataList = res.Content
if (this.dataList) {
this.dataList.forEach(item => {
if (item.Datetime == this.Timer) {
this.CPUTotalUsage = item.CPUProcessUsage
}
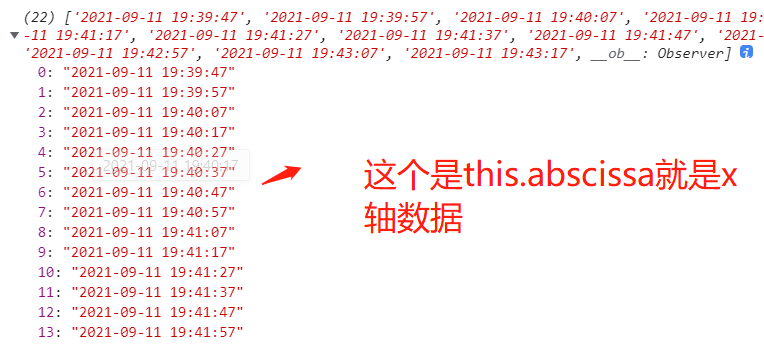
this.abscissa.push(item.Datetime)
this.ordinateList.CPUTotalUsage.push(item.CPUTotalUsage)
this.ordinateList.CPUProcessUsage.push(item.CPUProcessUsage)
this.ordinateList.MemTotalUsage.push(item.MemTotalUsage)
this.ordinateList.MemProcessUsage.push(item.MemProcessUsage)
this.ordinateList.GPUTotalUsage.push(item.GPUTotalUsage)
this.ordinateList.GPUMemUsage.push(item.GPUMemUsage)
this.ordinateList.FPS.push(item.FPS)
this.ordinateList.NetworkRecvSpeed.push(item.NetworkRecvSpeed)
this.ordinateList.NetworkSendSpeed.push(item.NetworkSendSpeed)
})
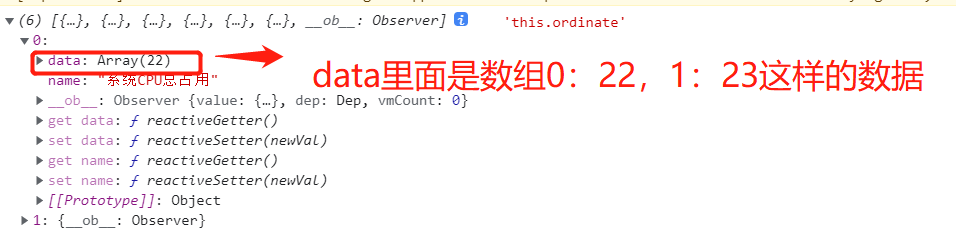
this.ordinate = [
{
name: '系统CPU总占用',
data: this.ordinateList.CPUTotalUsage
},
{
name: '应用CPU占用',
data: this.ordinateList.CPUProcessUsage
},
{
name: '系统内存总占用',
data: this.ordinateList.MemTotalUsage
},
{
name: '应用内存占用',
data: this.ordinateList.MemProcessUsage
},
{
name: '系统GPU总占用',
data: this.ordinateList.GPUTotalUsage
},
{
name: '系统显存总占用',
data: this.ordinateList.GPUMemUsage
}
]
} else {
this.loading = false
this.showFlag = false
}
} else {
this.showFlag = false
this.$message({
message: res.Msg,
type: 'error'
})
}
})
我们看下返回的数据都是什么这是整个接口的返回 我们就取一些数据

这个就是子组件echarts的组件实例
<template>
<div class="echarts" ref="echarts"></div>
</template>
<script>
import echarts from 'echarts'
import wonderland from './echarts'
export default {
props: {
abscissa: {
type: Array,
default: () => []
},
ordinate: {
type: Array,
default: () => []
},
title: String,
titleList: {
type: Array,
default: () => []
},
unit: String,
Timer: String,
CPUInfoList: String
},
data() {
return {
chart: null,
myChart: null,
option: {},
lineList: []
}
},
mounted() {},
watch: {
abscissa(newV, oldV) {
this.draw()
}
},
methods: {
draw() {
this.chart = this.$refs.echarts
this.chart.style.width = document.documentElement.clientWidth - 200 + 'px'
this.chart.style.height = 300 + 'px'
echarts.init(this.chart, 'wonderland').dispose()
echarts.registerTheme('wonderland', wonderland)
this.myChart = echarts.init(this.chart, 'wonderland')
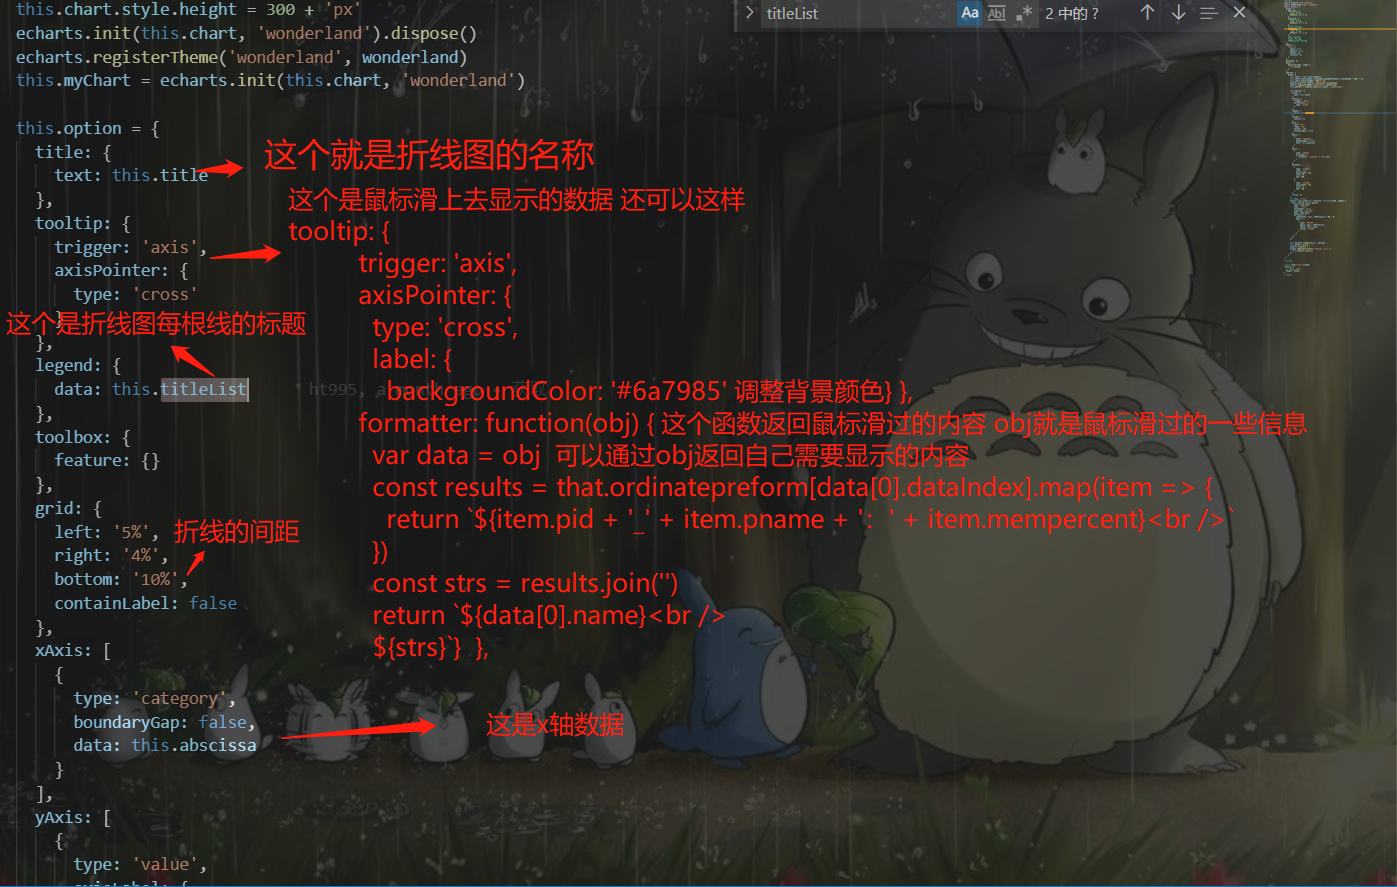
this.option = {
title: {
text: this.title
},
tooltip: {
trigger: 'axis',
axisPointer: {
type: 'cross'
}
},
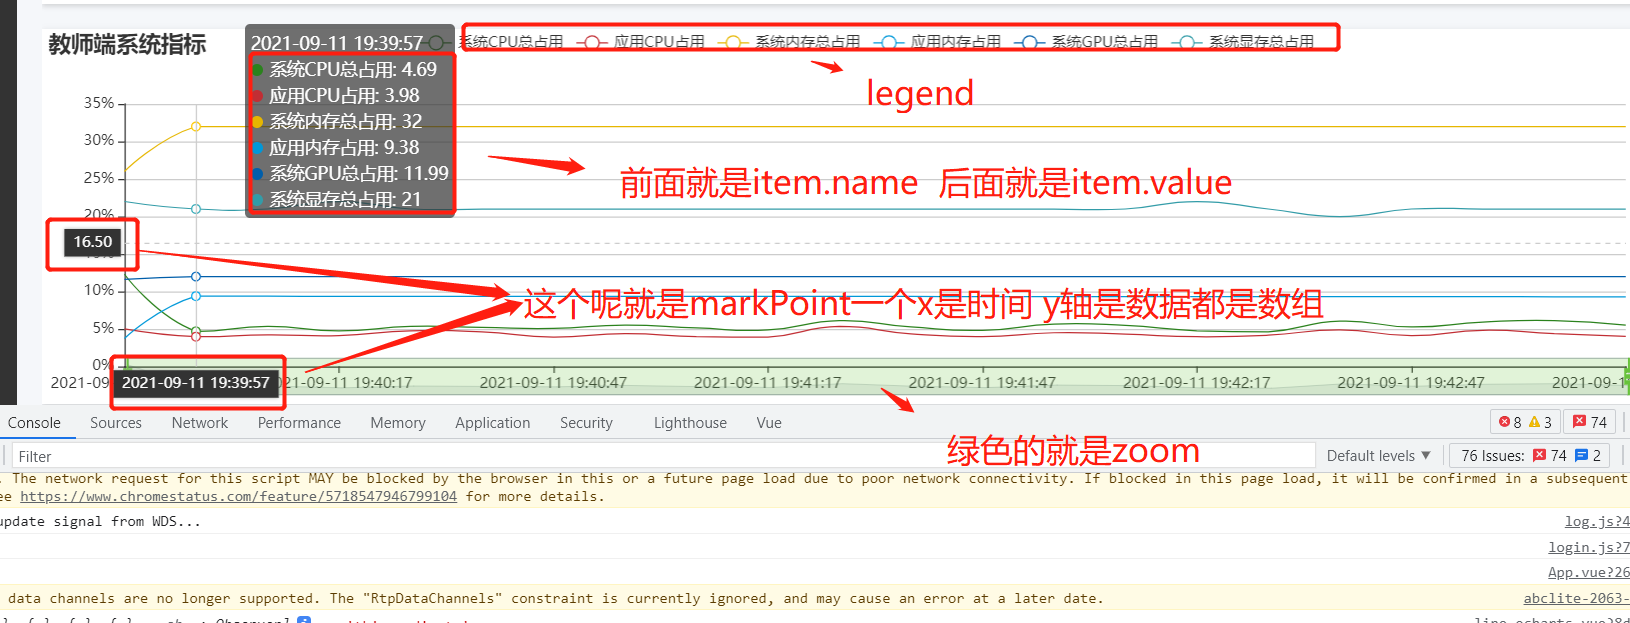
legend: {
data: this.titleList
},
toolbox: {
feature: {}
},
grid: {
left: '5%',
right: '4%',
bottom: '10%',
containLabel: false
},
xAxis: [
{
type: 'category',
boundaryGap: false,
data: this.abscissa
}
],
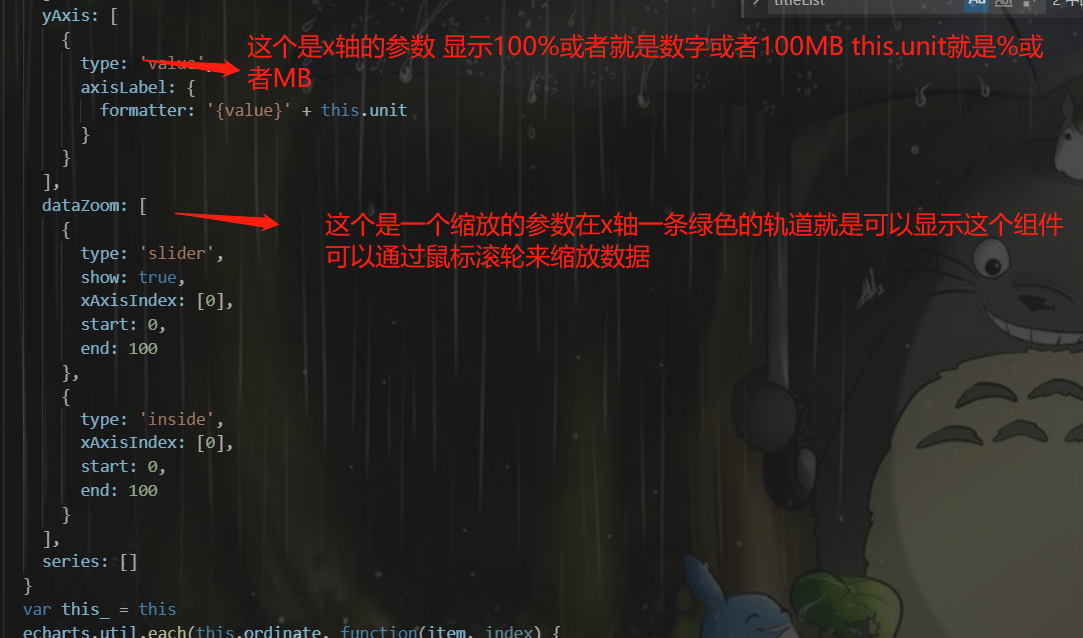
yAxis: [
{
type: 'value',
axisLabel: {
formatter: '{value}' + this.unit
}
}
],
dataZoom: [
{
type: 'slider',
show: true,
xAxisIndex: [0],
start: 0,
end: 100
},
{
type: 'inside',
xAxisIndex: [0],
start: 0,
end: 100
}
],
series: []
}
var this_ = this
echarts.util.each(this.ordinate, function(item, index) {
this_.option.series.push({
name: item.name,
type: 'line',
showSymbol: false,
sampling: 'average',
data: item.data,
markPoint: {
symbolSize: this_.CPUInfoList ? 60 : 0,
data: [
{
name: '某个坐标',
yAxis: this_.CPUInfoList,
xAxis: this_.Timer,
value: '崩溃点'
}
]
}
})
})
this.myChart.setOption(this.option)
this.myChart.group = '1'
echarts.connect('1')
window.addEventListener('resize', () => {
this.myChart.resize()
})
}
}
}
</script>
<style lang="scss" scoped>
.echarts {
// 100%;
height: 500px;
}
</style>