源码如下:
<!DOCTYPE html>
<html>
<head>
    <meta http-equiv="Content-Type" content="text/html; charset=UTF-8">
    <title>ECharts</title>
    <script src="http://echarts.baidu.com/dist/echarts.min.js"></script>
</head>
<body>
    <!-- 为ECharts准备一个具备大小(宽高)的Dom -->
    <div id="bar" style=" 600px;height:400px;"></div>

    <div id="pie" style=" 600px;height:400px;"></div>

</body>
<script type="text/javascript">
        // 基于准备好的dom,初始化echarts实例
        var myBarChart = echarts.init(document.getElementById('bar'));
        var n1 = Math.floor(Math.random()*500+1);
        var n2 = Math.floor(Math.random()*500+1);
        var n3 = Math.floor(Math.random()*500+1);
        var n4 = Math.floor(Math.random()*500+1);
        var n5 = Math.floor(Math.random()*500+1);
        var n6 = Math.floor(Math.random()*500+1);
        // 指定图表的配置项和数据
        var option = {
            title: {
                text: 'ECharts 入门示例'
            },
            tooltip: {
                triggerEvent:true},
            legend: {
                data:['销量',"趋势"]
            },
            xAxis: {
                data: ["衬衫","羊毛衫","雪纺衫","裤子","高跟鞋","袜子"],
                triggerEvent:true,  //可以点击x轴坐标,
                axisTick: {
                    alignWithLabel: true //坐标值是否在刻度中间
                }
            },
            yAxis: {
                type: 'value',
                splitArea: {
                    show: true
                },
                //百分比显示Y轴
                axisLabel: {
                  show: true,
                  interval: 'auto'
                },
                show: true,
                triggerEvent:true //可以点击y轴坐标
            },
            series: [{
                name: '销量',
                type: 'bar',
                data: [n1, n2, n3, n4, n5, n6],
                itemStyle: {
                    normal: {
                        label: {
                            show: true,
                            position: 'top'
                        }
                    }
                }
            },{
                name: '趋势',
                type: 'line',
                data: [n1, n2, n3, n4, n5, n6],
                smooth:false,   //是否为曲线,默认为false
                itemStyle:{
                    normal:{
                        lineStyle:{
                            1,       // 虚线的宽度
                            type:'dotted'  //'dotted'虚线 'solid'实线
                        }
                    }
                }
            }]
        };
        // 使用刚指定的配置项和数据显示图表。
        myBarChart.setOption(option);
        //方法1:https://zhuanlan.zhihu.com/p/33050579
        // var ids = [55,66,85,86,55,544,5,6,8,4,88,89];
      //这样就可以获取到点击柱子或者文本标签对应的id了
      // myBarChart.on('click', function (params) {
      //     if(params.componentType =="xAxis"){
      //         alert("单击了"+params.value+"x轴标签, 你点击的是第"+(Number(params.event.target.anid.split("_")[1])+1)+"个X标签;当前对应的id为:"+ids[params.event.target.anid.split("_")[1]]);
      //     }else{
      //         alert("单击了"+params.name+"柱状图, 你点击的是第"+(params.dataIndex+1)+"个柱状图;当前对应的id为:"+ids[params.dataIndex]);   //数组下标是从0开始的哦,图也是从0开始的
      //     }
      // });
      //方法二:https://blog.csdn.net/sophia_xiaoma/article/details/78055947
      myBarChart.on('click', function (params) {
        // 当componentType == "xAxis"或者 ==“yAxisx”时,取被点击时坐标轴的值params.value
            alert("单击了"+params.componentType+"x轴标签"+params.value);
        if(params.componentType == "xAxis"){
            alert("单击了"+params.value+"x轴标签"+params.name);
        }else{
            alert("单击了"+params.name+"柱状图"+params.value);
        }
      });
      //方法三:http://www.jb51.net/article/125820.htm
      // myBarChart.on("click", barConsole);
      // function barConsole(param) {
      //   //     获取data长度
      //   //   alert(option.series[0].data.length);
      //   //      获取地N个data的值
      //     alert(option.series[0].data[i]);
      //   //     获取series中param.dataIndex事件对应的值
      //   //   alert(option.series[param.seriesIndex].data[param.dataIndex]);
      //       // alert(param.value); //与上一行等价
      //   //    获取xAxis当前点击事件索引对应的值,可以用作传参了
      //         // alert(option.xAxis.data[param.dataIndex]);
      //     //param.dataIndex 获取当前点击索引,
      //   //   alert(param.dataIndex);
      //   //  当前点击事件位于series中的索引
      //   //   alert(param.seriesIndex);
      //   //   clickFunc(param.dataIndex);//执行点击效果
      //   //param具体包含的参数见 https://blog.csdn.net/allenjay11/article/details/76033232

      //   //刷新页面
      //   // location.reload();
      //   // window.location.reload();
      //       refresh();

      //   }

      //方法四:饼图添加事件示例 https://www.cnblogs.com/zhzhair-coding/p/6953982.html?utm_source=itdadao&utm_medium=referral
</script>

<script type="text/javascript">
    // 基于准备好的dom,初始化echarts实例
    var myPieChart = echarts.init(document.getElementById('pie'));
    var n1 = Math.floor(Math.random()*500+1);
    var n2 = Math.floor(Math.random()*500+1);
    var n3 = Math.floor(Math.random()*500+1);
    var n4 = Math.floor(Math.random()*500+1);
    var n5 = Math.floor(Math.random()*500+1);
    // 指定图表的配置项和数据
    var option = {
                "legend":{
                    "orient":"vertical",
                    "left":"left"
                },
                "series":[
                    {
                        "data":[
                            {
                                "name":"直接访问",
                                "value":n1
                            },
                            {
                                "name":"邮件营销",
                                "value":n2
                            },
                            {
                                "name":"联盟广告",
                                "value":n3
                            },
                            {
                                "name":"视频广告",
                                "value":n4
                            },
                            {
                                "name":"搜索引擎",
                                "value":n5
                            }
                        ],
                        "center":[
                            "50%",
                            "60%"
                        ],
                        "name":"访问来源",
                        "itemStyle":{
                            "normal":{
                                "label":{
                                    "formatter":"{b}
{c}
{d}%",
                                    "show":true
                                }
                            },
                            "emphasis":{
                                "shadowOffsetX":0,
                                "shadowBlur":10,
                                "shadowColor":"rgba(0, 0, 0, 0.5)"
                            }
                        },
                        "radius":"55%",
                        "type":"pie"
                    }
                ],
                "tooltip":{
                    "formatter":"{a} <br/>{b} : {c} ({d}%)",
                    "trigger":"item"
                },
                "title":{
                    "subtext":"纯属虚构",
                    "x":"center",
                    "text":"某站点用户访问来源"
                }
            };
    // 使用刚指定的配置项和数据显示图表。
    myPieChart.setOption(option);

    myPieChart.on("click", pieConsole);
  //方法三:http://www.jb51.net/article/125820.htm
  function pieConsole(param) {
    //     获取data长度
      alert(option.series[0].data.length);
    //      获取地N个data的值
    //   alert(option.series[0].data[i]);
    //     获取series中param.dataIndex事件对应的值
        alert(param.value);
        alert(param.name);
       alert(option.series[param.seriesIndex].data[param.dataIndex].value);
        alert(option.series[param.seriesIndex].data[param.dataIndex].name);
        //   clickFunc(param.dataIndex);//执行点击效果,触发相应js函数
    //param具体包含的方法见 https://blog.csdn.net/allenjay11/article/details/76033232

    //刷新页面
    // location.reload();
    // window.location.reload();
    }
</script>

<!--每5秒自动刷新页面-->
<script type="text/javascript">
    function refresh(){
    // 刷新页面
    // location.reload();
        window.location.reload();
    };

    // setInterval(refresh, 5000);//5秒钟执行一次
</script>
</html>
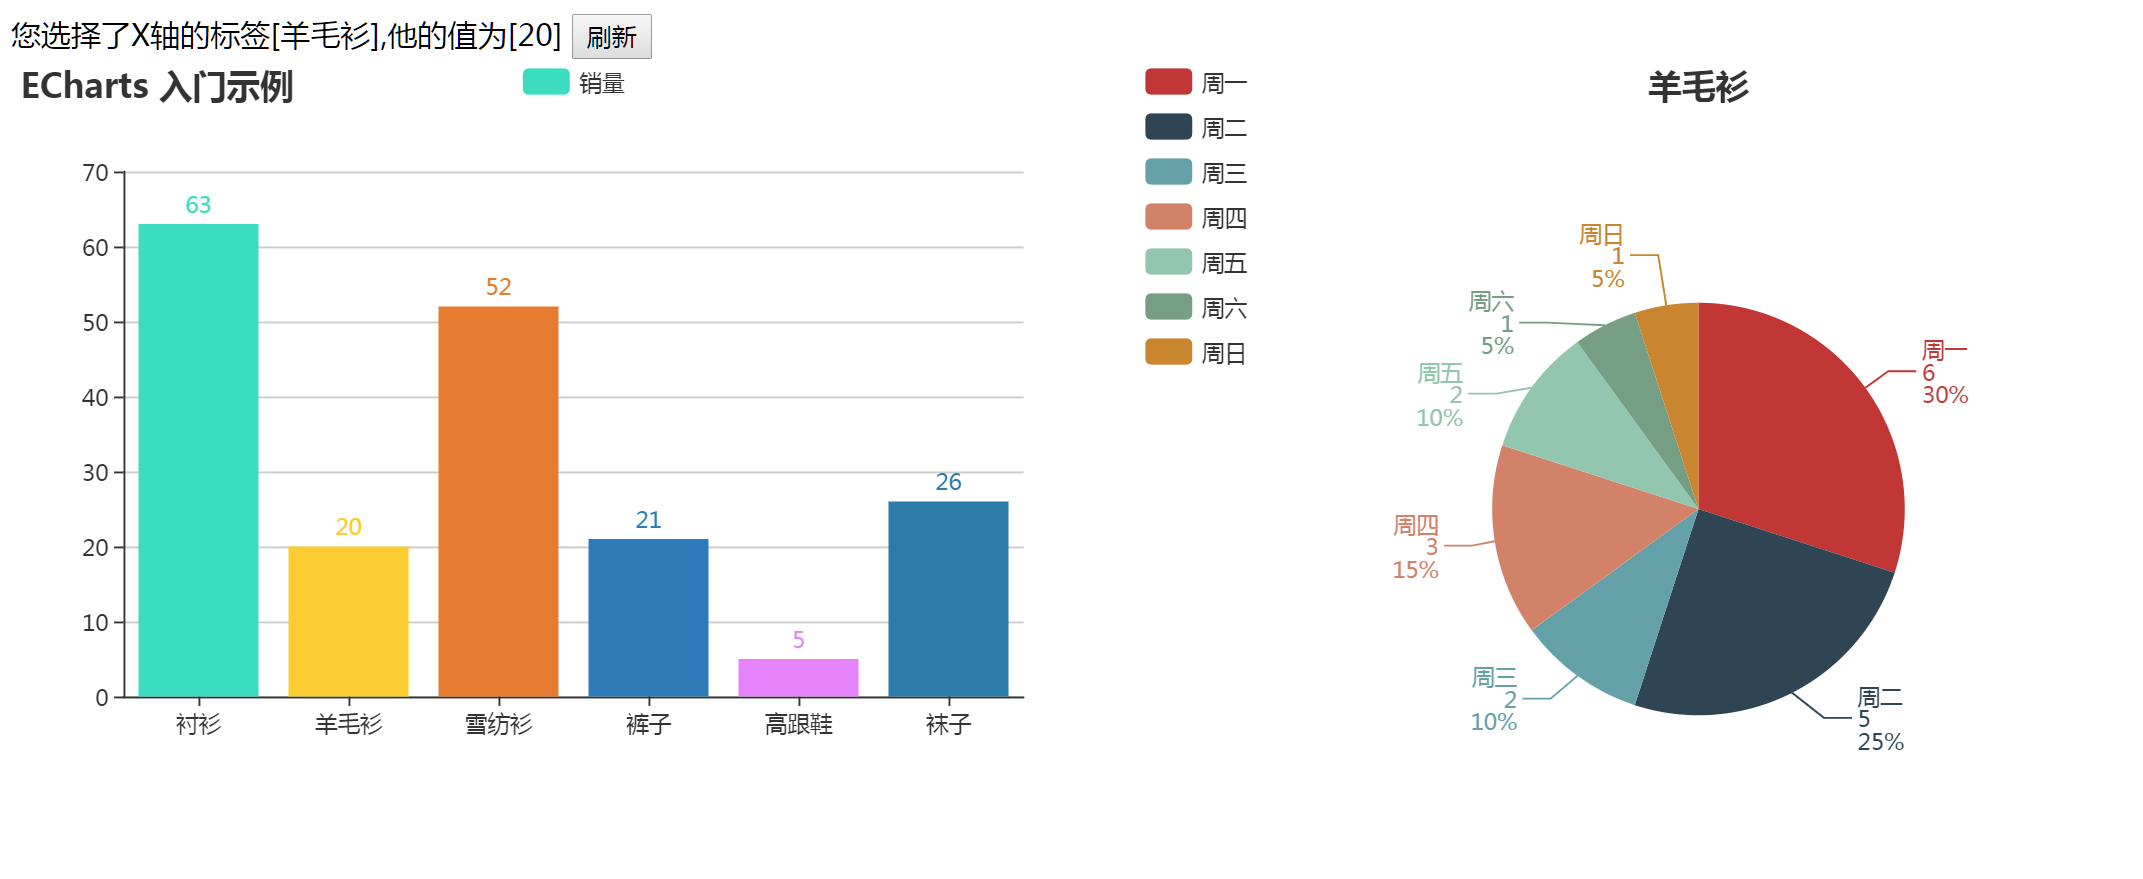
显示效果如下: