zoukankan      html  css  js  c++  java
  • Echart自定义属性3


    echart:

    <!DOCTYPE html>
    <html lang="en">
    <head>
        <meta charset="UTF-8">
        <title>Document</title>
        <script src="https://apps.bdimg.com/libs/jquery/1.9.1/jquery.min.js"></script>
        <script type="text/javascript" src="http://echarts.baidu.com/gallery/vendors/echarts/echarts.min.js"></script>
    </head>
    <body>
        <div class="chart_content">
            <div id="container" style=" 400px;height: 300px"></div>
        </div>
    
        <script type="text/javascript">
            var dom = document.getElementById("container");
            var myChart = echarts.init(dom);
            var app = {};
            option = null;
            option = {
                color: ['#aac13d'], //Y轴字的颜色
                //设置字体样式
                textStyle: {
                    fontSize: 14,
                    fontWeight: 700 
                },
                grid: {
                    top: '3%',
                    bottom:'0',
                    left:'0',
                    right:'3%',
                    containLabel: true
                },
                xAxis: {
                    axisTick: {
                        show: false   //去掉x轴刻度
                    },
                    splitLine: {  
                        show: true,
                        lineStyle: {  
                            // 使用深浅的间隔色  
                            color: ['#ffddc9']  
                        }  
                    },  
                    boundaryGap: false,
                    data: [76,77,78,79,80,81,82,83,84,85],
                    axisLine:{
                        symbol:['none','arrow'],//X轴箭头
                        lineStyle:{
                            color:'#ea3076',  //x轴颜色
                            1,//这里是为了突出显示加上的  
                        }
                    },
                },
                 yAxis: {
                    axisTick : {show: false},//去掉刻度
                    splitLine: {  
                        lineStyle: {  
                            // 使用深浅的间隔色  
                            color: ['#ffddc9']  
                        }  
                    },  
                    min:0,
                    max:100,
                    axisLabel:{   //修改y轴的数据
                            formatter: function (value) {
                                var texts = [];
                                if(value==0){}
                                else if(value<=20){
                                    texts.push('不佳');
                                }
                                else if (value <=40) {
                                    texts.push('略差');
                                }
                                else if (value <= 60) {
                                    texts.push('普通');
                                }
                                else if(value <= 80){
                                    texts.push('不错');
                                }
                                else{
                                    texts.push('很好');
                                }
                                return texts;
                            }
                    },
                    //设置轴线的属性
                    axisLine:{
                        symbol:['none','arrow'],//Y轴箭头
                        lineStyle:{
                            color:'#e9386f',  
                            1,//这里是为了突出显示加上的  
                        }
                    },
                },
                series: [{
                    data: [35,45,25,35,65,85,40,35,45,35],
                    type: 'line',
                    smooth: false,//true 为平滑曲线,false为直线
                    // areaStyle: {} //背景填充颜色
                }]
            };
            ;
            if (option && typeof option === "object") {
                myChart.setOption(option, true);
            }
        </script>
        
    </body>
    </html>

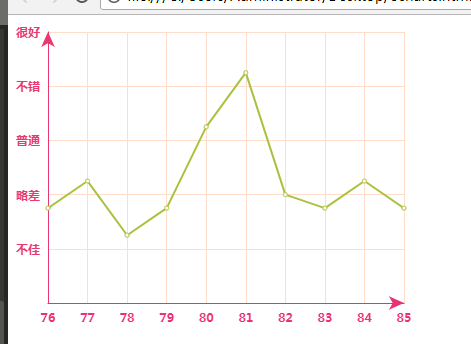
    效果图:
  • 相关阅读:
    WPF Caliburn 学习笔记(五)HelloCaliburn
    MSDN 教程短片 WPF 20(绑定3ObjectDataProvider)
    MSDN 教程短片 WPF 23(3D动画)
    比赛总结一
    HDU3686 Traffic Real Time Query System
    HDU3954 Level up
    EOJ382 Match Maker
    UESTC1565 Smart Typist
    HDU3578 Greedy Tino
    ZOJ1975 The Sierpinski Fractal
  • 原文地址:https://www.cnblogs.com/huanghuali/p/9173370.html
Copyright © 2011-2022 走看看