a. 一维数据集
用 Numpy ndarray 作为数据传入 ply
import numpy as np
import matplotlib as mpl
import matplotlib.pyplot as plt

np.random.seed(1000)
y = np.random.standard_normal(10)
print "y = %s"% y
x = range(len(y))
print "x=%s"% x
plt.plot(y)
plt.show()
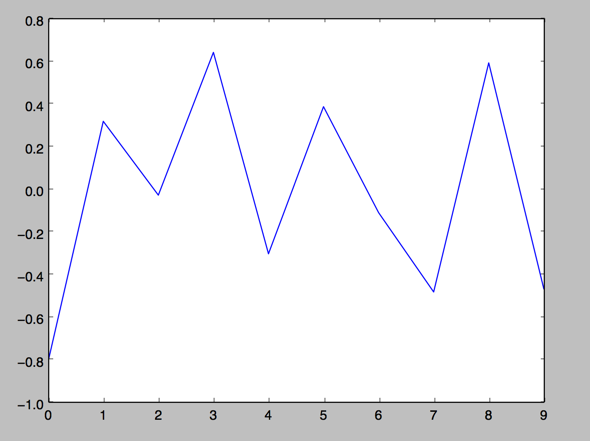
2.操纵坐标轴和增加网格及标签的函数
import numpy as np
import matplotlib as mpl
import matplotlib.pyplot as plt

np.random.seed(1000)
y = np.random.standard_normal(10)
plt.plot(y.cumsum())
plt.grid(True) ##增加格点
plt.axis('tight') # 坐标轴适应数据量 axis 设置坐标轴
plt.show()

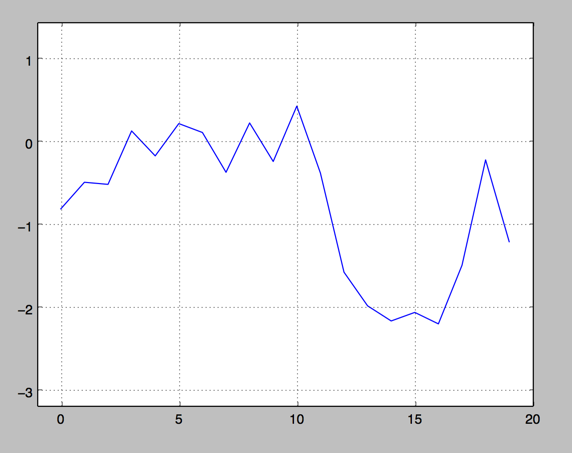
3.plt.xlim 和 plt.ylim 设置每个坐标轴的最小值和最大值
#!/etc/bin/python
#coding=utf-8
import numpy as np
import matplotlib as mpl
import matplotlib.pyplot as plt

np.random.seed(1000)
y = np.random.standard_normal(20)
plt.plot(y.cumsum())
plt.grid(True) ##增加格点
plt.xlim(-1,20)
plt.ylim(np.min(y.cumsum())- 1, np.max(y.cumsum()) + 1)

plt.show()