zoukankan      html  css  js  c++  java
  • Echarts-画堆积柱状图

    导入echarts包

    <script src='../scripts/libraries/echarts/echarts-all.js'></script>
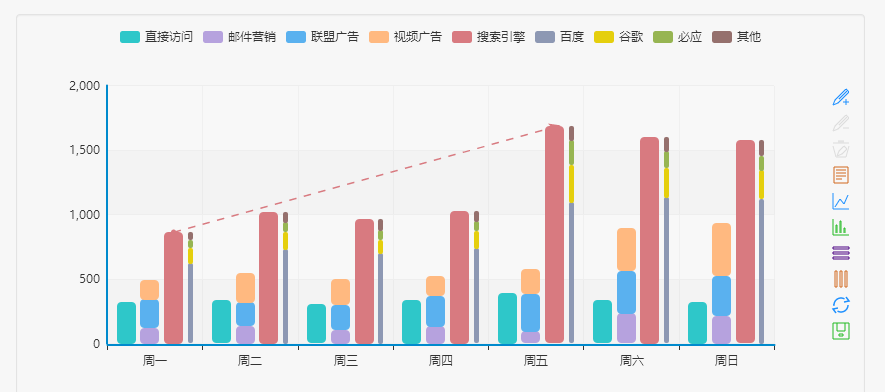
    堆积图js

    $(function () {
        var myChart = echarts.init(document.getElementById('main1'));
        myChart.setOption({
            title : {
                text : ""
            },
            tooltip : {
                trigger : 'axis',
                showDelay : 0, // 显示延迟,添加显示延迟可以避免频繁切换,单位ms
                axisPointer : {            // 坐标轴指示器,坐标轴触发有效
                    type : 'shadow'        // 默认为直线,可选为:'line' | 'shadow'
                }
            },
            legend: {
                data:['直接访问', '邮件营销','联盟广告','视频广告','搜索引擎']
            },
            toolbox: {
                show : true,
                feature : {
                    mark : {show: true},
                    dataView : {show: true, readOnly: false},
                    magicType : {show: true, type: ['line', 'bar', 'stack', 'tiled']},
                    restore : {show: true},
                    saveAsImage : {show: true}
                }
            },
            calculable : true,
            xAxis : [
                {
                    type : 'value'
                }
            ],
            yAxis : [
                     {
                         type : 'category',
                         data : ['周一','周二','周三','周四','周五','周六','周日']
                     }
                 ],
             series : [
                 {
                     name:'直接访问',
                     type:'bar',
                     stack: '总量',
                     itemStyle : { normal: {label : {show: true, position: 'insideRight'}}},
                     data:[320, 302, 301, 334, 390, 330, 320]
                 },
                 {
                     name:'邮件营销',
                     type:'bar',
                     stack: '总量',
                     itemStyle : { normal: {label : {show: true, position: 'insideRight'}}},
                     data:[120, 132, 101, 134, 90, 230, 210]
                 },
                 {
                     name:'联盟广告',
                     type:'bar',
                     stack: '总量',
                     itemStyle : { normal: {label : {show: true, position: 'insideRight'}}},
                     data:[220, 182, 191, 234, 290, 330, 310]
                 },
                 {
                     name:'视频广告',
                     type:'bar',
                     stack: '总量',
                     itemStyle : { normal: {label : {show: true, position: 'insideRight'}}},
                     data:[150, 212, 201, 154, 190, 330, 410]
                 },
                 {
                     name:'搜索引擎',
                     type:'bar',
                     stack: '总量',
                     itemStyle : { normal: {label : {show: true, position: 'insideRight'}}},
                     data:[820, 832, 901, 934, 1290, 1330, 1320]
                 }
             ]
        });
    });    

     以上堆积柱状图为横着这摆放,如需要竖着摆放这将xAxis 和yAxis兑换就可

     html页面

    <div class="chart" id="main1" style="margin-bottom:-70px;margin-top:-50px;"></div>


  • 相关阅读:
    关于下下载typora的相关说明
    Vue项目vscode 安装eslint插件的方法(代码自动修复)
    [0].Net开发者社区--您好大的官威啊!
    关于hadoop安装后无法访问web界面查看查看 NameNode 和 Datanode 信息
    C#(winform)记录阻止关闭页面方法
    Android开发:记录Cannot resolve symbol'R'问题解决记录
    C#Winform开发杂项记录
    C#Winform 使用NPOI导入、导出Excel
    C#记录一些用到的比对方法
    C#(Winform开发)Excel导出
  • 原文地址:https://www.cnblogs.com/hwaggLee/p/4752165.html
Copyright © 2011-2022 走看看