1、源码如下:
/**
* @Title:LineChart.java
* @Package:com.you.jfreechart
* @Description:折线图
* @author:Youhaidong(游海东)
* @date:2013-7-24 下午9:51:22
* @version V1.0
*/
package com.you.jfreechart;
import java.awt.Color;
import java.awt.Font;
import org.jfree.chart.ChartFactory;
import org.jfree.chart.ChartFrame;
import org.jfree.chart.JFreeChart;
import org.jfree.chart.axis.CategoryAxis;
import org.jfree.chart.axis.CategoryLabelPositions;
import org.jfree.chart.plot.CategoryPlot;
import org.jfree.chart.plot.PlotOrientation;
import org.jfree.chart.title.LegendTitle;
import org.jfree.data.category.DefaultCategoryDataset;
/**
* 类功能说明
* 类修改者 修改日期
* 修改说明
* <p>Title:LineChart.java</p>
* <p>Description:游海东个人开发</p>
* <p>Copyright:Copyright(c)2013</p>
* @author:游海东
* @date:2013-7-24 下午9:51:22
* @version V1.0
*/
public class LineChart {
/**
* @Title:main
* @Description:折线图
* @param:@param args
* @return: void
* @throws
*/
public static void main(String[] args) {
//赋值
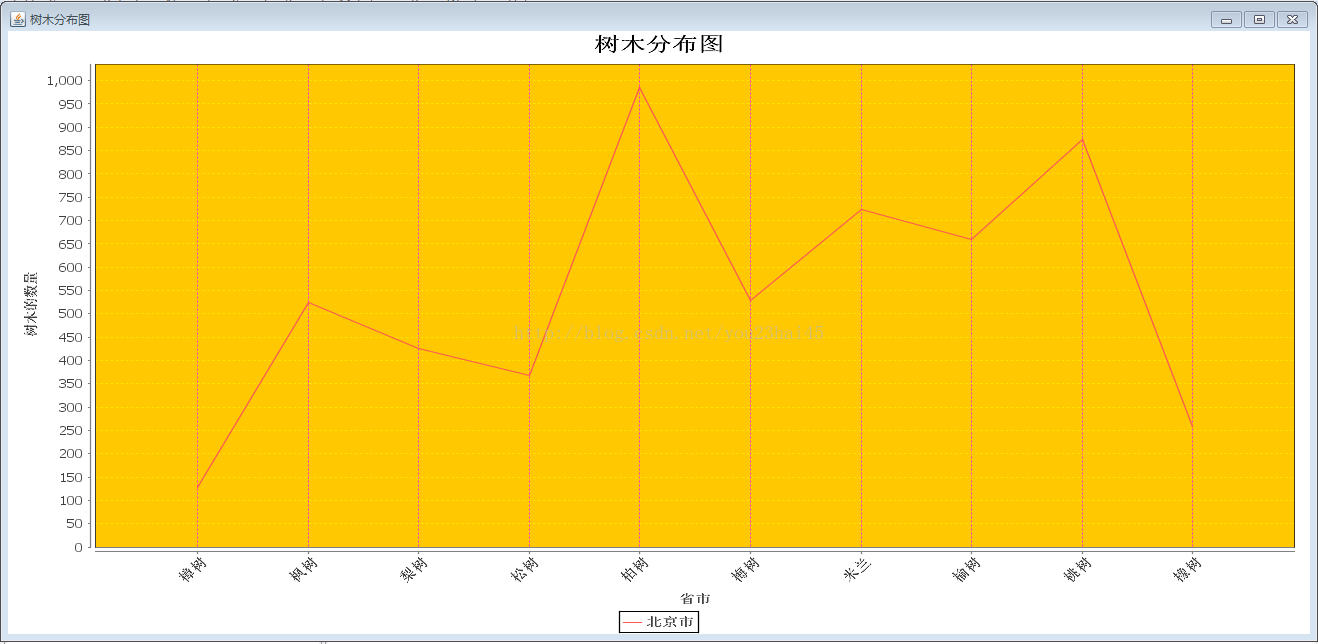
DefaultCategoryDataset dataset = new DefaultCategoryDataset();
dataset.setValue(128, "北京市", "樟树");
dataset.setValue(524, "北京市", "枫树");
dataset.setValue(425, "北京市", "梨树");
dataset.setValue(368, "北京市", "松树");
dataset.setValue(986, "北京市", "柏树");
dataset.setValue(529, "北京市", "梅树");
dataset.setValue(724, "北京市", "米兰");
dataset.setValue(659, "北京市", "榆树");
dataset.setValue(874, "北京市", "桃树");
dataset.setValue(258, "北京市", "橡树");
//调用生成折线方法
JFreeChart chart = ChartFactory.createLineChart("树木分布图", "省市",
"树木的数量", dataset, PlotOrientation.VERTICAL, true, true, false);
//设置背景色
chart.setBackgroundPaint(Color.white);
CategoryPlot categoryPlot = chart.getCategoryPlot();
//设置画布背景色
categoryPlot.setBackgroundPaint(Color.orange);
//设置折线颜色
categoryPlot.setDomainGridlinePaint(Color.magenta);
categoryPlot.setDomainGridlinesVisible(true);
//设置水平线颜色
categoryPlot.setRangeGridlinePaint(Color.yellow);
CategoryAxis categoryAxis = categoryPlot.getDomainAxis();
//设置X轴标题名向上45度
categoryAxis.setCategoryLabelPositions(CategoryLabelPositions.UP_45);
//解决X轴中文乱码
categoryAxis.setLabelFont(new Font("宋体",Font.BOLD,12));
categoryAxis.setTickLabelFont(new Font("宋体",Font.BOLD,12));
categoryPlot.getRangeAxis().setLabelFont(new Font("宋体",Font.BOLD,12));
//解决标题乱码
chart.getTitle().setFont(new Font("宋体",Font.BOLD,20));
//设置弹出窗口
ChartFrame chartFrame = new ChartFrame("树木分布图", chart);
chartFrame.pack();
chartFrame.setVisible(true);
//解决Legend乱码问题
LegendTitle legendTitle = chart.getLegend(0);
legendTitle.setItemFont(new Font("宋体",Font.BOLD,12));
}
}
2、显示结果如下图: