1. 绘制图表组成元素的主要函数
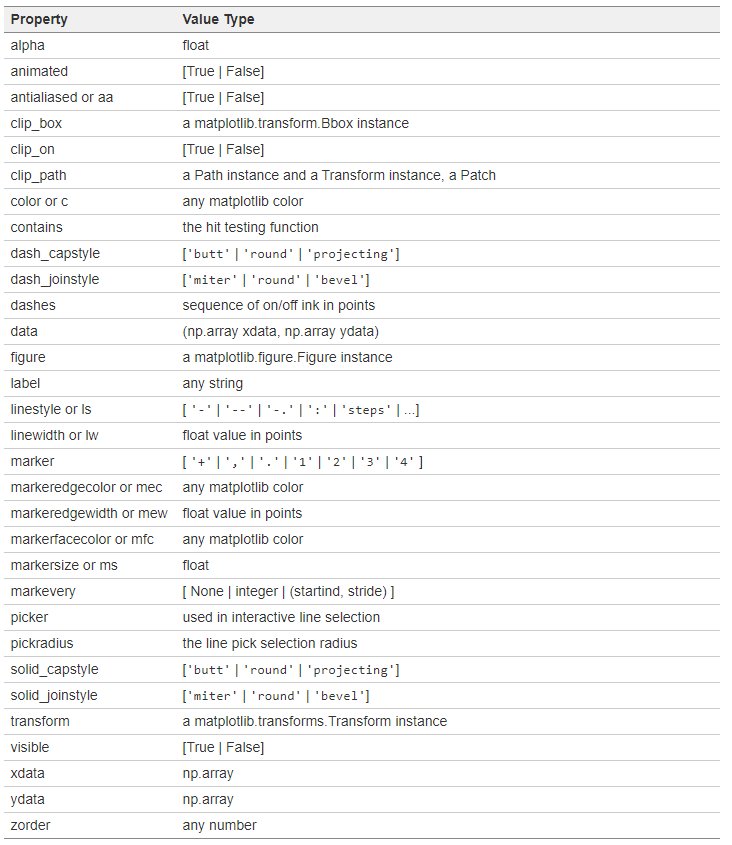
1.1 plot()——展现量的变化趋势
import numpy as np
import matplotlib.pyplot as plt
import matplotlib
matplotlib.use('Qt5Agg')

x = np.linspace(0.05, 10, 1000)
y = np.cos(x)

plt.plot(x, y, ls="-", lw=2, label="plot figure")
plt.legend()
plt.show()
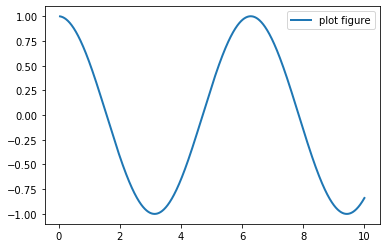
1.2 scatter()——寻找变量之间的关系
import numpy as np
import matplotlib.pyplot as plt
import matplotlib
matplotlib.use('Qt5Agg')

x = np.linspace(0.05, 10, 1000)
y = np.random.rand(1000)

plt.scatter(x, y, label="scatter figure")
plt.legend()
plt.show()
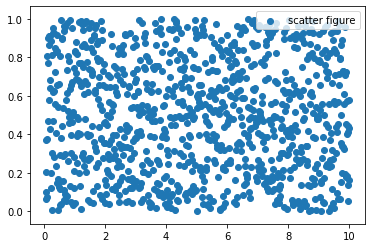
1.3 xlim()——设置x轴的数值显示范围
import numpy as np
import matplotlib.pyplot as plt
import matplotlib
matplotlib.use('Qt5Agg')

x = np.linspace(0.05, 10, 1000)
y = np.random.rand(1000)

plt.scatter(x, y, label="scatter figure")
plt.legend()
plt.xlim(0.05, 10)
plt.ylim(0, 1)
plt.show()
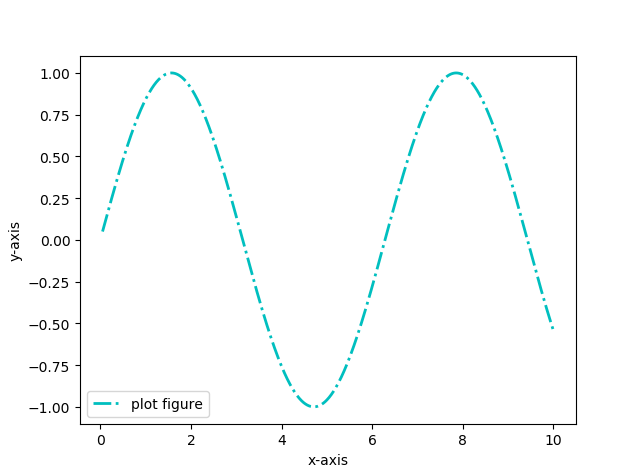
1.4 xlabel()——设置x轴的标签文本
import numpy as np
import matplotlib.pyplot as plt
import matplotlib
matplotlib.use('Qt5Agg')

x = np.linspace(0.05, 10, 1000)
y = np.sin(x)

plt.plot(x, y, ls="--", lw=2, c="c", label="plot figure")
plt.legend()
plt.xlabel("x-axis")
plt.ylabel("y-axis")
plt.show()
1.5 grid()——绘制刻度线的网格线
import numpy as np
import matplotlib.pyplot as plt
import matplotlib

matplotlib.use('Qt5Agg')

x = np.linspace(0.05, 10, 1000)
y = np.sin(x)

plt.plot(x, y, ls="-.", lw=2, c="c", label="plot figure")
plt.legend()
plt.grid(linestyle=":", color="r")
plt.show()
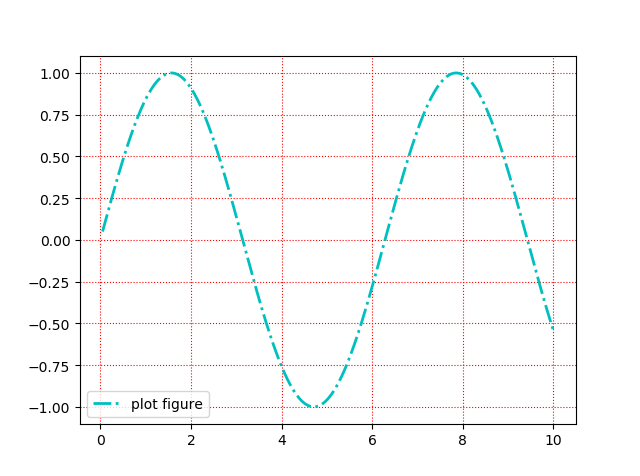
grid()函数的主要参数为grid(b, which, axis, color, linestyle, linewidth, **kwargs):
b:布尔值。就是是否显示网格线的意思。官网说如果b设置为None, 且kwargs长度为0,则切换网格状态which:取值为major,minor,both。 默认为majoraxis:取值为both,x,y。就是想绘制哪个方向的网格线color:这就不用多说了,就是设置网格线的颜色。或者直接用c来代替color也可以linestyle:也可以用ls来代替linestyle, 设置网格线的风格,是连续实线,虚线或者其它不同的线条
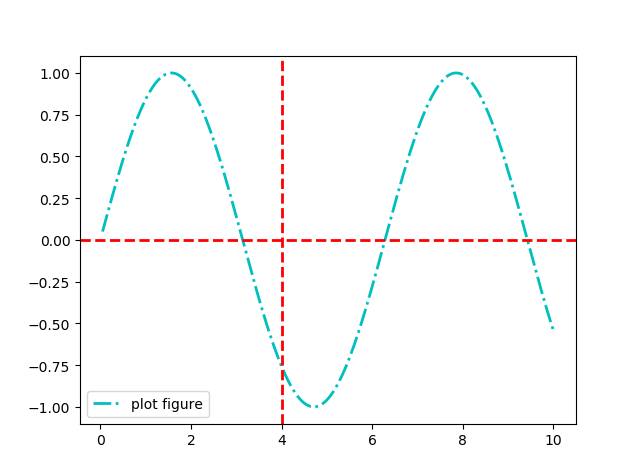
1.6 axhline()——绘制平行于x轴的水平参考线
import numpy as np
import matplotlib.pyplot as plt
import matplotlib

matplotlib.use('Qt5Agg')

x = np.linspace(0.05, 10, 1000)
y = np.sin(x)

plt.plot(x, y, ls="-.", lw=2, c="c", label="plot figure")
plt.legend()
plt.axhline(y=0.0, c="r", ls="--", lw=2)
plt.axvline(x=4.0, c="r", ls="--", lw=2)
plt.show()
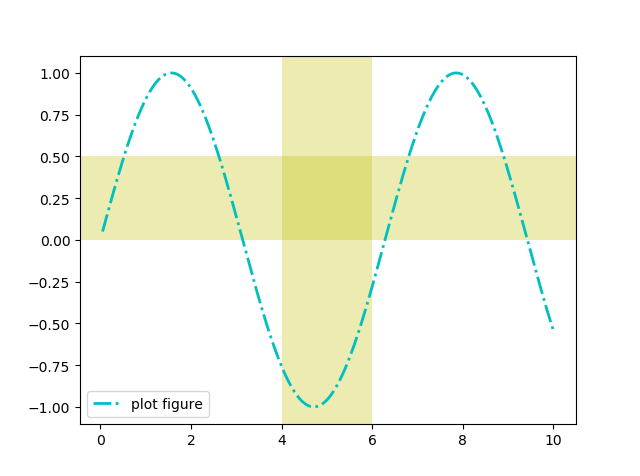
1.7 axvspan()——绘制垂直于x轴的参考区域
import numpy as np
import matplotlib.pyplot as plt
import matplotlib

matplotlib.use('Qt5Agg')

x = np.linspace(0.05, 10, 1000)
y = np.sin(x)

plt.plot(x, y, ls="-.", lw=2, c="c", label="plot figure")
plt.legend()
plt.axvspan(xmin=4.0, xmax=6.0, facecolor="y", alpha=0.3)
plt.axhspan(ymin=0.0, ymax=0.5, facecolor="y", alpha=0.3)
plt.show()
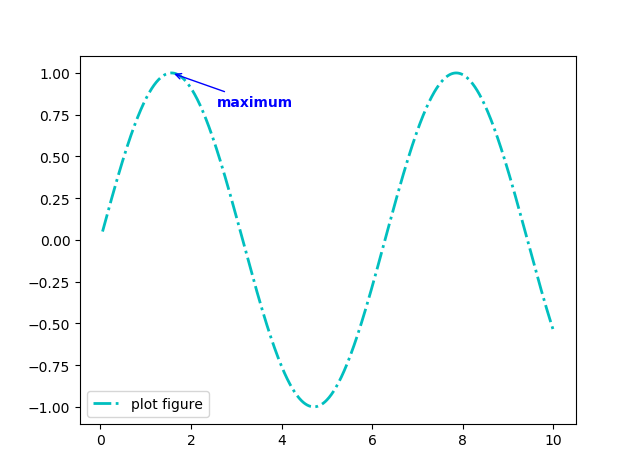
1.8 annotate()——添加图形内容细节的指向型注释文本
import numpy as np
import matplotlib.pyplot as plt
import matplotlib

matplotlib.use('Qt5Agg')

x = np.linspace(0.05, 10, 1000)
y = np.sin(x)

plt.plot(x, y, ls="-.", lw=2, c="c", label="plot figure")
plt.legend()
plt.annotate(s="maximum",
             xy=(np.pi / 2, 1.0),
             xytext=((np.pi / 2) + 1.0, 0.8),
             weight="bold",
             color="b",
             arrowprops=dict(arrowstyle="->", connectionstyle="arc3", color="b")
             )
plt.show()
xy:被注释图形内容的位置坐标
xytext:注释文本的位置坐标
weight:注释文本的字体粗细风格
color:注释文本的字体颜色
arrowprops:指示被注释内容的箭头的属性字典
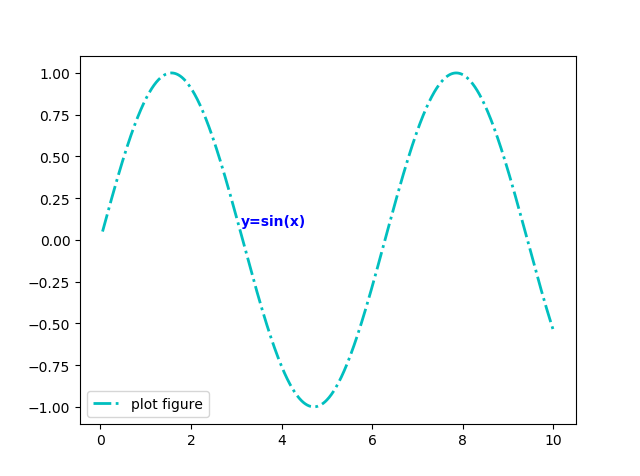
1.9 text()——添加图形内容细节的无指向型注释文本
import numpy as np
import matplotlib.pyplot as plt
import matplotlib

matplotlib.use('Qt5Agg')

x = np.linspace(0.05, 10, 1000)
y = np.sin(x)

plt.plot(x, y, ls="-.", lw=2, c="c", label="plot figure")
plt.legend()
plt.text(x=3.10, y=0.09, s="y=sin(x)", weight="bold", color="b")
plt.show()
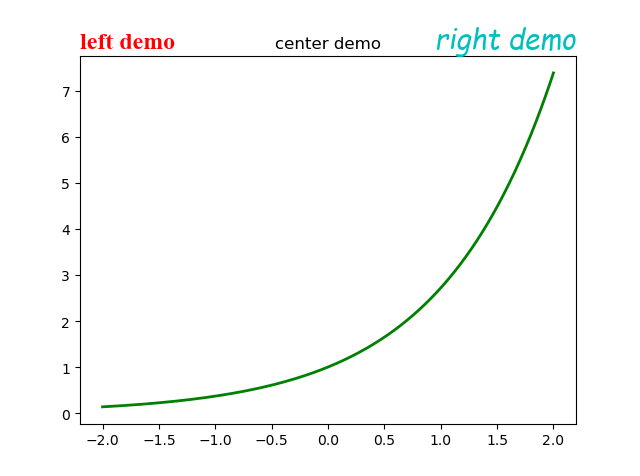
1.10 title()——添加图形内容的标题
import numpy as np
import matplotlib as mpl
import matplotlib.pyplot as plt

x = np.linspace(-2, 2, 1000)
y = np.exp(x)

plt.plot(x, y, ls="-", lw=2, color="g")

plt.title("center demo")

plt.title("left demo", loc="left",
          fontdict={"size": "xx-large",
                    "color": "r",
                    "family": "Times New Roman"})

plt.title("right demo", loc="right",
          family="Comic Sans MS", size=20,
          style="oblique", color="c")

plt.show()
主要参数都在上面代码里体现了
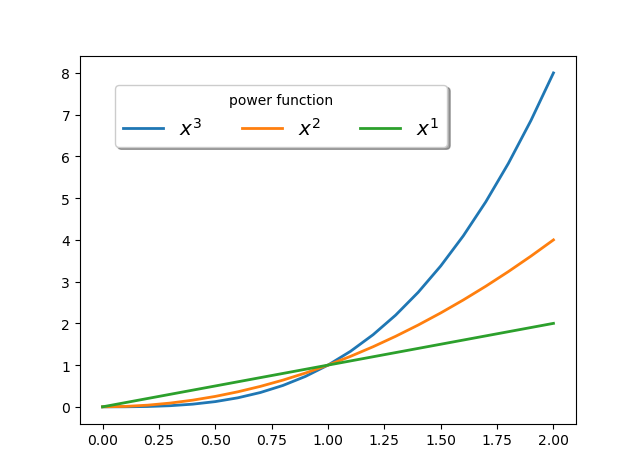
1.11 legend()——表示不同图形的文本标签图例
import numpy as np
import matplotlib as mpl
import matplotlib.pyplot as plt

x = np.arange(0, 2.1, 0.1)
y = np.power(x, 3)
y1 = np.power(x, 2)
y2 = np.power(x, 1)

plt.plot(x, y, ls="-", lw=2, label="$x^3$")
plt.plot(x, y1, ls="-", lw=2, label="$x^2$")
plt.plot(x, y2, ls="-", lw=2, label="$x^1$")

plt.legend(loc="upper left",fontsize="x-large", bbox_to_anchor=(0.05, 0.95), ncol=3,
           title="power function", shadow=True, fancybox=True)

plt.show()
loc参数控制图例的位置,可选值为:
bestupper rightupper leftlower leftlower rightrightcenter leftcenter rightlower centerupper centercenter
fontsize控制图例字体大小,可选值为:
intfloatxx-smallx-smallsmallmediumlargex-largexx-large
frameon:True或False,是否显示图例边框edgecolor:图例边框颜色facecolor:图例背景颜色,若无边框,参数无效title:设置图例标题fancybox:True表示线框直角,False表示线框圆角shadow:True或False,是否显示阴影
2. 常用配置参数
2.1 线型
linestyle或ls
-:实线--:虚线-.:点划线::点线
2.2 线宽
linewidth或lw
- 浮点数
2.3 线条颜色
color或c
b:blue,蓝色g:green,绿色r:red,红色c:cyan,蓝绿m:magenta,洋红y:yellow,黄色k:black,黑色w:white,白色
也可以对关键字参数color赋十六进制的RGB字符串如 color='#900302'
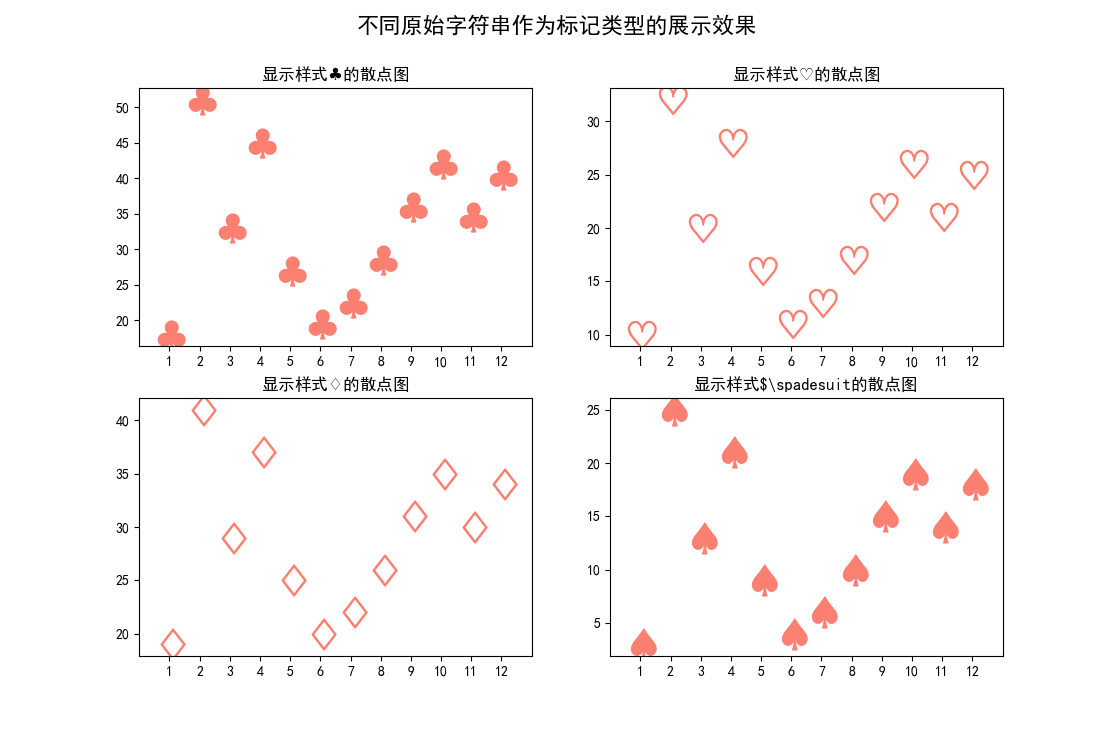
2.4 点标记类型
marker,只能用以下简写符号表示
.:point marker,:pixel markero:circle markerv:triangle_down marker^:triangle_up marker<:triangle_left marker>:triangle_right marker1:tri_down marker2:tri_up marker3:tri_left marker4:tri_right markers:square markerp:pentagon marker*:star markerh:hexagon1 markerH:hexagon2 marker+:plus markerx:x markerD:diamond markerd:thin_diamond marker|:vline marker_:hline marker
特别地,标记还有mathtext模式
import numpy as np
import matplotlib.pyplot as plt
import matplotlib as mpl

mpl.use('Qt5Agg')
mpl.rcParams['font.sans-serif'] = ['SimHei']
mpl.rcParams['font.serif'] = ['SimHei']
mpl.rcParams['axes.unicode_minus'] = False  # 解决保存图像是负号'-'显示为方块的问题,或者转换负号为字符串

x = np.arange(1, 13, 1)
y = np.array([12, 34, 22, 30, 18, 13, 15, 19, 24, 28, 23, 27])

fig, ax = plt.subplots(2, 2)

ax[0, 0].scatter(x, y * 1.5, marker=r"$clubsuit$", c="#fb8072", s=500)
ax[0, 0].locator_params(axis="x", tight=True, nbins=11)
ax[0, 0].set_xlim(0, 13)
ax[0, 0].set_xticks(x)
ax[0, 0].set_title('显示样式{}的散点图'.format(r"$clubsuit$"))

ax[0, 1].scatter(x, y - 2, marker=r"$heartsuit$", c="#fb8072", s=500)
ax[0, 1].locator_params(axis="x", tight=True, nbins=11)
ax[0, 1].set_xlim(0, 13)
ax[0, 1].set_xticks(x)
ax[0, 1].set_title('显示样式{}的散点图'.format(r"$heartsuit$"))

ax[1, 0].scatter(x, y + 7, marker=r"$diamondsuit$", c="#fb8072", s=500)
ax[1, 0].locator_params(axis="x", tight=True, nbins=11)
ax[1, 0].set_xlim(0, 13)
ax[1, 0].set_xticks(x)
ax[1, 0].set_title('显示样式{}的散点图'.format(r"$diamondsuit$"))

ax[1, 1].scatter(x, y - 9, marker=r"$spadesuit$", c="#fb8072", s=500)
ax[1, 1].locator_params(axis="x", tight=True, nbins=11)
ax[1, 1].set_xlim(0, 13)
ax[1, 1].set_xticks(x)
ax[1, 1].set_title('显示样式{}的散点图'.format(r"$spadesuit"))

plt.suptitle("不同原始字符串作为标记类型的展示效果", fontsize=16, weight="black")

plt.show()
官网有一张属性表,先贴在这,以后有空会再补充内容的