Despite what a lot of people believe, it's easy to introduce memory and resources leaks in .NET applications. The Garbage Collector, or GC for close friends, is not a magician who would completely relieve you from taking care of your memory and resources consumption.
I'll explain in this article why memory leaks exist in .NET and how to avoid them. Don't worry, I won't focus here on the inner workings of the garbage collector and other advanced characteristics of memory and resources management in .NET.
It's important to understand leaks and how to avoid them, especially since they are not the kind of things that is easy to detect automatically. Unit tests won't help here. And when your application crashes in production, you'll be in a rush looking for solutions. So, relax and take the time to learn more about this subject before it's too late.
Table of Content
- Introduction
- Leaks? Resources? What do you mean?
- How to detect leaks and find the leaking resources
- Common memory leak causes
- Common memory leaks causes demonstrated
- Static references
- Events, or the "lapsed listener" issue
- Static events
- Dispose method not invoked
- Incomplete Dispose method
- Windows Forms: BindingSource misused
- CAB: Removal from WorkItem missing
- How to avoid leaks
- Tools
- Windows Performance Monitor
- Bear
- GDIUsage
- dotTrace
- .NET Memory Profiler
- .NET profilers
- SOS.dll and WinDbg
- Custom tooling
- Conclusion
- Resources
Introduction
Recently, I've been working on a big .NET project (let's name it project X) for which one of my duties was to track memory and resources leaks. I was mostly looking after leaks related to the GUI, more precisely in a Windows Forms application based on the Composite UI Application Block (CAB).
While some of the information that I'll expose here applies directly to Windows Forms, most of the points will equally apply to any kind of .NET applications (WPF, Silverlight, ASP.NET, Windows service, console application, etc.)
I wasn't an expert in leak hunting before I had to delve into the depths of the application to do some cleaning. The goal of the present article is to share with you what I learned in the process. Hopefully, it will be useful to anyone who needs to detect and fix memory and resources leaks.
We'll start by giving an overview of what leaks are, then we'll see how to detect leaks and find the leaking resources, how to solve and avoid leaks, and we'll finish with a list of helpful tools and...resources.
Leaks? Resources? What do you mean?
Memory leaks
Before going further, let's defined what I call a "memory leak". Let's simply reuse the definition found in Wikipedia. It perfectly matches what I intend to help you solve with this article:
In computer science, a memory leak is a particular type of unintentional memory consumption by a computer program where the program fails to release memory when no longer needed. This condition is normally the result of a bug in a program that prevents it from freeing up memory that it no longer needs.
Still in Wikipedia: "Languages that provide automatic memory management, like Java, C#, VB.NET or LISP, are not immune to memory leaks."
The garbage collector recovers only memory that has become unreachable. It does not free memory that is still reachable. In .NET, this means that objects reachable by at least one reference won't be released by the garbage collector.
Handles and resources
Memory is not the only resource to keep an eye on. When your .NET application runs on Windows, it consumes a whole set of system resources. Microsoft defines three categories of system objects: user, graphics device interface (GDI), and kernel. I won't give here the complete list of objects. Let's just name important ones:
- The system uses User objects to support window management. They include: Accelerator tables, Carets, Cursors, Hooks, Icons, Menus and Windows.
- GDI objects support graphics: Bitmaps, Brushes, Device Contexts (DC), Fonts, Memory DCs, Metafiles, Palettes, Pens, Regions, etc.
- Kernel objects support memory management, process execution, and inter-process communications (IPC): Files, Processes, Threads, Semaphores, Timers, Access tokens, Sockets, etc.
You can find all the details about system objects on MSDN.
In addition to system objects, you'll encounter handles. As stated on MSDN, applications cannot directly access object data or the system resource that an object represents. Instead, an application must obtain an object handle, which it can use to examine or modify the system resource.
In .NET however, this will be transparent most of the time because system objects and handles are represented directly or indirectly by .NET classes.
Unmanaged resources
Resources such as system objects are not a problem in themselves, however I cover them in this article because operating systems such as Windows have limits on the number of sockets, files, etc. that can be open simultaneously. That's why it's important that you pay attention to the quantity of system objects you application uses.
Windows has quotas for the number of User and GDI objects that a process can use at a given time. The default values are 10,000 for GDI objects and 10,000 for User objects. If you need to read the values set on your machine, you can use the following registry keys, found in HKEY_LOCAL_MACHINESOFTWAREMicrosoftWindows NTCurrentVersionWindows: GDIProcessHandleQuota and USERProcessHandleQuota.
Guess what? It's not even that simple. There are other limits you can reach quickly. See my blog post about the Desktop Heap, for example.
Given that these values can be customized, you may think that a solution to break the default limits is to raise the quotas. I think that this is a bad idea for several reasons:
- Quotas exist for a reason: your application is not alone on the system and it should share the system resources with the other processes running on the machine.
- If you change them on your machine, they may be different on another one. You have to make sure that the change is done on all the machines your application will run on, which doesn't come without issues from a system administration point of view.
- The default quotas are more than enough most of the time. If you find the quotas are not enough for your application, then you probably have some cleaning to do.
How to detect leaks and find the leaking resources
The real problem with leaks is well stated in an article about leaks with GDI code:
Even a little leak can bring down the system if it occurs many times.
This is similar to what happens with leaking water. A drop of water is not a big issue. But drop by drop, a leak can become a major problem.
As I'll explain later, a single insignificant object can maintain a whole graph of heavy objects in memory.
Still in the same article, you can learn that:
There are usually three steps in leak eradication:
- Detect a leak
- Find the leaking resource
- Decide where and when the resource should be released in the source code
The most direct way to "detect" leaks is to suffer from them.
You won't likely see your computer run out of memory. "Out of memory" messages are quite rare. This is because when operating systems run out of RAM, they use hard disk space to extend the memory workspace (this is called virtual memory).
What you're more likely to see happen are "out of handles" exceptions in your Windows graphical applications. The exact exception is either a System.ComponentModel.Win32Exception or aSystem.OutOfMemoryException with the following message: "Error creating window handle". This happens when two many resources are consumed at the same time, most likely because of objects not being released while they should.
Another thing you may see even more often is your application or the whole computer getting slower and slower. This can happen because your machine is simply getting out of resources.
Let me make a blunt assertion: most applications leaks. Most of the time it's not a problem because the issues resulting from leaks show up only if you use applications intensively and for a long period of time.
If you suspect that objects are lingering in memory while they should have been released, the first thing you need to do is to find what these objects are.
This may seem obvious, but what's not so obvious is how to find these objects.
What I suggest is that you look for unexpected and lingering high level objects or root containers with your favorite memory profiler. In project X, this can be objects such as LayoutView instances (we use the MVP pattern with CAB/SCSF). In your case, it all depends on what the root objects are.
The next step is to find why these objects are being kept in memory while they shouldn't be. This is where debuggers and profilers really help. They can show you how objects are linked together.
It's by looking at the incoming references to the zombie object you have identified that you'll be able to find the root cause of the problem.
You can choose to follow the the ninja way (See SOS.dll and WinDbg in the section about tools below).
I used the JetBrains dotTrace tool for project X and that's what I'll use in this article too. I'll tell you more about this tool later in the same Tools section.
Your goal should be to find the root reference. Don't stop at the first object you'll find, but ask yourself why this object is kept in memory.
Common memory leak causes
I wrote above that leaks are common in .NET. The good news is that there is only a small set of causes. That means that you won't have to look for a lot of cases when you'll try to solve a leak.
Let's review the usual culprits I've identified:
- Static references
- Event with missing unsubscription
- Static event with missing unsubscription
- Dispose method not invoked
- Incomplete Dispose method
In addition to these classical traps, here are other more specific problem sources:
- Windows Forms: BindingSource misused
- CAB: missing Remove call on WorkItem
The culprits I've just listed concern your applications, but you should understand that leaks can happen in other pieces of .NET code that your applications rely on. There can actually be bugs in libraries you use.
Let's take an example. In project X, a third-party visual controls suite is used to build the GUI. One of these controls is used to display toolbars. The way it is used is via a component that manages a list of toolbars. This works fine, except that even though the toolbar class implements IDisposable, the manager class never calls the Dispose method on the toolbars it manages. This is a bug. Fortunately, a workaround is easy to find: just call Dispose by ourselves on each toolbar. Unfortunately, this is not enough because the toolbar class itself is buggy: it does not dispose the controls (buttons, labels, etc.) it contains. Again, the solution is to dispose each control the toolbar contain, but that's not so easy this time because each sub-control is different.
Anyway, this is just a specific example. My point is that any libraries and components you use may cause leaks in your applications.
Finally, I'd like to add that saying "It's the .NET framework that leaks!" is adopting a very bad stance that consists in washing your hands of it. Even if it can of course happen that .NET creates leaks by itself, it's something that remains exceptional and that you'll encounter very rarely.
It is easy to blame .NET, but you should instead start by questioning your own code before offloading issues onto someone else...
Common memory leaks causes demonstrated
I've listed the main sources of leaks, but I don't want to stop here. I think that this article will be much more useful if I can illustrate each point with a quick example. So, let's take Visual Studio and dotTrace and walk through some sample code. I'll show at the same time how to solve or avoid each leak.
Project X is built with CAB and the MVP (Model-View-Presenter) pattern, that means that the GUI consists of workspaces, views and presenters. To keep things simple, I've decided to use a basic Windows Forms application with a set of forms. This is the same approach as the one used by Jossef Goldberg in his post about memory leaks in WPF-based applications. I'll even reuse the same examples for event handlers.
When a form is closed and disposed, we expect it to be released from memory, right? What I'll show below is how the causes I listed above prevent the forms to be released.
Here is the main form of the sample application I've created:
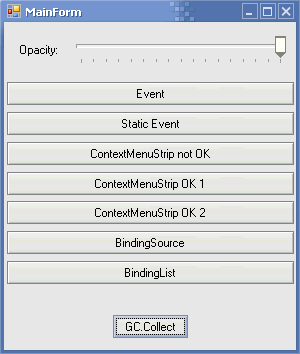
This main form can open different child forms; each can cause a separate memory leak.
You'll find the source code of this sample application at the end of this article, in the Resources section.
Static references
Let's get rid of the obvious first. If an object is referenced by a static field, then it will never be released.
This is also true with such things as singletons. Singletons are often static objects, and if it's not the case, they are usually long-lived objects anyway.
This may be obvious, but keep in mind that not only direct references are dangerous. The real danger comes from indirect references. In fact, you must pay attention to the chains of references. What counts is the root of each chain. If the root is static, then all the objects down the chain will stay alive forever.
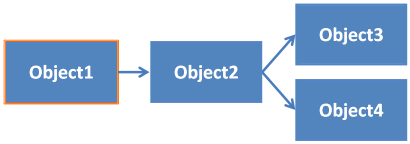
If Object1 on the above diagram is static, and most likely long-lived, then all the other objects down the reference chain will be kept in memory for a long time. The danger is that the chain can be too long to realize that the root of the chain is static. If you care about only one level of depth, you will consider that Object3 and Object4 will go away when Object2 goes away. That's correct, for sure, but you need to take into account the fact that they may never go away because Object1 keeps the whole object graph alive.
Be very careful with all kinds of statics. Avoid them if possible. If not, pay careful attention to the objects your static objects and singletons keep in memory.
A specific kind of risky statics are static events. I'll cover them just after I cover events in general.
Events, or the "lapsed listener" issue
A child form is subscribing to an event of the main form to get notified when the opacity changes (EventForm.cs):
mainForm.OpacityChanged += mainForm_OpacityChanged;
The problem is that the subscription to the OpacityChanged event creates a reference from the main form to the child form.
Here is how objects are connected after the subscription:

See this post of mine to learn more about events and references. Here is a figure from this post that shows the "back" reference from a subject to its observers:

Here is what you'll see in dotTrace if you search for EventForm and click on "Shortest" in "Root Paths":

As you can see, MainForm keeps a reference to EventForm. This is the case for each instance of EventForm that you'll open in the application. This means that all the child forms that you'll open will stay in memory while the application is alive, even if you don't use them anymore.
Not only does this maintain the child forms in memory, but it also causes exceptions if you change the opacity after a child form has been closed because the main form tries to notify a disposed form.
The most simple solution is to remove the reference by having the child forms unsubscribe from the main form's event when they get disposed:
Disposed += delegate { mainForm.OpacityChanged -= mainForm_OpacityChanged; };
Nota Bene: We have a problem here because the MainForm object remains alive until the application is shut down. Interconnected objects with shorter lifetimes may not cause issues with memory. Any isolated graph of objects gets unloaded automatically from memory by the garbage collector. An isolated graph of objects is formed by two objects that only reference one another, or by a group of connected objects without any external reference.
Another solution would be to use weak delegates, which are based on weak references. I touch this subject in my post about events and references. Several articles on the Web demonstrate how to put this into action. Here is a good one, for example. Most of the solutions you'll find are based on the WeakReference class. You can learn more about weak references in .NET on MSDN.
Note that a solution for this exists in WPF, in the form of the WeakEvent pattern.
There are other solutions if you work with frameworks such as in CAB (Composite UI Application Block) or Prism (Composite Application Library), respectively EventBroker and EventAggregator. If you want, you can also use your own implementation of the event broker/aggregator/mediator pattern.
Event handlers with missing unsubscriptions from events on static or long-lived objects are a problem. Another one is static events.
Static events
Let's see an example directly (StaticEventForm.cs):
SystemEvents.UserPreferenceChanged += SystemEvents_UserPreferenceChanged;
This is similar to the previous case, except that this time we subscribe to a static event. Since the event is static, the listener form object will never get released.

Again, the solution is to unsubscribe when we're done:
SystemEvents.UserPreferenceChanged -= SystemEvents_UserPreferenceChanged;
Dispose method not invoked
You've paid attention to events, static or not? Great, but that's not enough. You can still get lingering references even with correct cleanup code. This happens sometimes simply because this cleanup code doesn't get invoked...
Using the Dispose method or the Disposed event to unsubscribe from event and to release resources is a best practice, but it's useless if Dispose doesn't get called.
Let's take an interesting example. Here is sample code that creates a context-menu for a form (ContextMenuStripNotOKForm.cs):
ContextMenuStrip menu = new ContextMenuStrip();
menu.Items.Add("Item 1");
menu.Items.Add("Item 2");
this.ContextMenuStrip = menu;
Here is what you'll see with dotTrace after the form has been closed and disposed:

The ContextMenuStrip is still alive in memory! Note: To see the problem happen, show the context-menu with a right-click before closing the form.
Again this is a problem with static events. The solution is the same as usual:
Disposed += delegate { ContextMenuStrip.Dispose(); };
I guess you start to understand how events can be dangerous in .NET if you don't pay careful attention to them and the references they imply.
What I want to stress here is that it's easy to introduce a leak with just a line of code. Would you have thought about potential memory leaks when creating a context-menu?
It's even worst than what you imagine. Not only the ContextMenuStrip is maintained alive, but it maintains the complete form alive with it!
In the following screenshot, you can see that the ContextMenuStrip references the form:

The result is that the form will be alive as long as the ContextMenuStrip is. Oh, of course you should not forget that while the form is alive, it maintains itself a whole set of objects alive - the controls and components it contains, to start with:
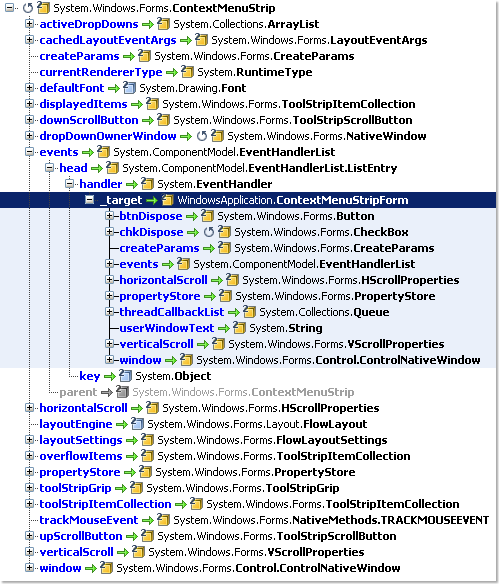
This is something that I find important enough to warrant a big warning. A small object can potentially maintain big graphs of other objects in memory. I've seen this happen all the time in project X. This is the same with water: a small leak can cause big damages.
Because a single control points to its parent or to events of its parent, it has the potential to keep a whole chain of container controls alive if it hasn't been disposed. And of course, all the other controls contained in these containers are also kept in memory. This can for example lead to a complete form and all its content that remain in memory for ever (at least until the application stops).
At this point, you may be wondering if this problem always exists with ContextMenuStrip. It doens't. Most of the time, you create ContextMenuStrips with the designer directly on their form, and in this case Visual Studio generates code that ensures the ContextMenuStrip components get disposed correctly.
If you're interested in knowing how this is handled, you can take a look at the ContextMenuStripOKForm class and its components field in the ContextMenuStripOKForm.Designer.cs file.
I'd like to point out another situation I've seen in project X. For some reason there was no .Designer.cs files associated with the source files of some controls. The designer code was directly in the .cs files. Don't ask me why. Besides the unusual (and not recommended) code structure, the problem was that the designer code had not been completely copied: either the Dispose method was missing or the call tocomponents.Dispose was missing. I guess you understand the bad things that can happen in these cases.
Incomplete Dispose method
I guess that you've now understood the importance of calling Dispose on all objects that have this method. However, the is one thing I'd like to stress about Dispose. It's great to have your classes implement the IDisposable interface and to include calls to Dispose and using blocks all over your code, but that's really useful only if the Dispose methods are implemented correctly.
This remark may seem a bit stupid, but if I make it it's because I've seen many cases where the code of Dispose methods was not complete.
You know how it happens. You create your classes; you have them implement IDisposable; you unsubscribe from events and release resources in Dispose; and you call Dispose everywhere. That's fine, until later on you have one of your classes subscribe to a new event or consume a new resource. It's easy to code, you're eager to finish coding and to test your code. It runs fine and you're happy with it. You checkin. Great! But... oops, you've forgotten to update Dispose to release everything. It happens all the time.
I won't provide an example for this. It should be pretty obvious.
Note: In addition to the Dispose method, you should learn about the Finalize method too. Dispose enables explicit resource cleanup, while Finalize enables implicit cleanup. The two should be used in combination. All this is well explained in this article by Joydip Kanjilal.
Windows Forms: BindingSource misused
Let's address an issue specific to Windows Forms. If you use the BindingSource component, be sure you use it the way it has been designed to be.
I've seen code that exposed BindingSource via static references. This leads to memory leaks because of the way a BindingSource behaves. A BindingSource keeps a reference to controls that use it as their DataSource, even after these controls have been disposed.
Here is what you'll see with dotTrace after a ComboBox has been disposed if its DataSource is a static (or long-lived) BindingSource (BindingSourceForm.cs):

A solution to this issue is to expose a BindingList instead of a BindingSource. You can, for example, drop a BindingSource on your form, assign the BindingList as the DataSource for the BindingSource, and assign the BindingSource as the DataSource for the ComboBox. This way, you still use a BindingSource.
See BindingListForm.cs in the sample source code to see this in action.
This doesn't prevent you from using a BindingSource, but it should be created in the view (the form here) that uses it. That makes sense anyway: BindingSource is a presentation component defined in the System.Windows.Forms namespace. BindingList, in comparison, is a collection that's not attached to visual components.
Note: If you don't really need a BindingSource, you can simply use just a BindingList all the way.
CAB: Removal from WorkItem missing
Here is now an advice for CAB applications, but that you can apply to other kinds of applications.
WorkItems are central when building CAB applications. A WorkItem is a container that keeps track of alive objects in a context, and performs dependency injection. Usually, a view gets added to a WorkItem after it's created. When the view is closed and should be released, it should be removed from its WorkItem, otherwise the WorkItem will keep the view alive because it maintains a reference to it.
Leaks can happen if you forget to remove views from their WorkItem.
In project X, we use the MVP design pattern (Model-View-Presenter). Here is how the various elements are connected when a view is displayed:
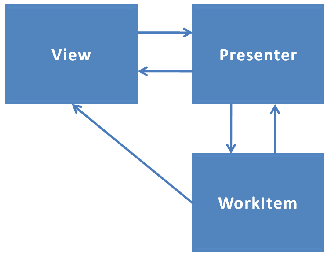
Note that the presenter is also added to the WorkItem, so it can benefit from dependency injection too. Most of the time, the presenter is injected to the view by the WorkItem, by the way. To ensure that everything gets released properly in project X, we use a chain-of-responsibility as follows:

When a view is disposed (most likely because it has been closed), its Dispose method is invoked. This method in turn invokes the Dispose method of the presenter. The presenter, which knows the WorkItem, removes the view and itself from the WorkItem. This way, everything is disposed and released properly.
We have base classes that implement this chain-of-responsibility in our application framework, so that views developers don't have to re-implement this and worry about it every time. I encourage you to implement this kind of pattern in your applications, even if they are not CAB applications. Automating release patterns right into your objects will help you avoid leaks by omission. It will also ensure that this processing is implemented only in one way, and not differently by each developer because she/he may not know a proper way of doing it - which could lead to leaks by lack of know-how.
How to avoid leaks
Now that you know more about leaks and how then can happen, I'd like to stress a few points and give you some tips.
Let's first discuss about a general rule. Usually, an object that creates another object is responsible for disposing it. Of course, this is not the case if the creator is a factory.
The reverse: an object that receives a reference to another object is not responsible for disposing it.
In fact, this really depends on the situation. In any case, what's important to keep in mind is who owns an object.
Second rule: Each += is a potential enemy!
Given my own experience, I'd say that events are the main source of leaks in .NET. They deserve double- and even triple-checks. Each time you add a subscription to an event in your code, you should worry about the consequences and ask yourself whether you need to add a -= to unsubscribe from the event. If you have to, do it immediately before you forget about it. Often, you'll do that in a Dispose method.
Having listener objects unsubscribe from the events they subscribe to is usually the recommended way to ensure they can be collected. However, when you absolutely know that an observed object wont publish notifications anymore and you wish that its subscribers can be released, you can force the removal of all the subscriptions to the observed object. I have a code sample on my blog that shows how to do this.
A quick tip now. Often, issues start to appear when object references are shared among several objects. This happens because it may become difficult to keep track of what references what. Sometimes it's better to clone objects in memory and have views work with the clones rather than having views and model objects intertwined.
Finally, even if it's a well-known best practice in .NET, I'd like to stress one more time the importance of calling Dispose. Each time you allocate a resource, make sure you call Dispose or encapsulate the use of the resource in a using block. If you don't do this all the time, you can quickly end up with leaking resources - most of the time unmanaged resources.
Tools
Several tools are available to help you detect leaks, and track object instances as well as system objects and handles. Let's name a few.
Windows Performance Monitor
On production machines, it's usually better not to have to install anything new to detect leaks. Luckily, you can start with tools integrated with Windows.
This article will show you how to use the Windows Performance Monitor (PerfMon), for example.
Bear
Bear is a free program that displays for all processes running under Windows:
- the usage of all GDI objects (hDC, hRegion, hBitmap, hPalette, hFont, hBrush)
- the usage of all User objects (hWnd, hMenu, hCursor, SetWindowsHookEx, SetTimer and some other stuff)
- the handle count

GDIUsage
Another useful tool is GDIUsage. This tool is free too and comes with source code.
GDIUsage focuses on GDI Objects. With it, you can take a snapshot of the current GDI consumption, perform an action that might cause leaks, and make a comparison between the previous resources usage and the current one. This helps a lot because it allows you to see what GDI objects have been added (or released) during the action.
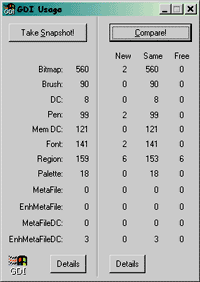
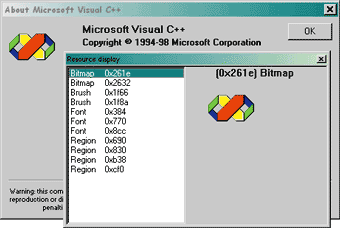
In addition, GDIUsage doesn't only give you numbers, but can also provide a graphical display of the GDI Objects. Visualizing what bitmap is leaked makes it easier to find why it has been leaked.
dotTrace
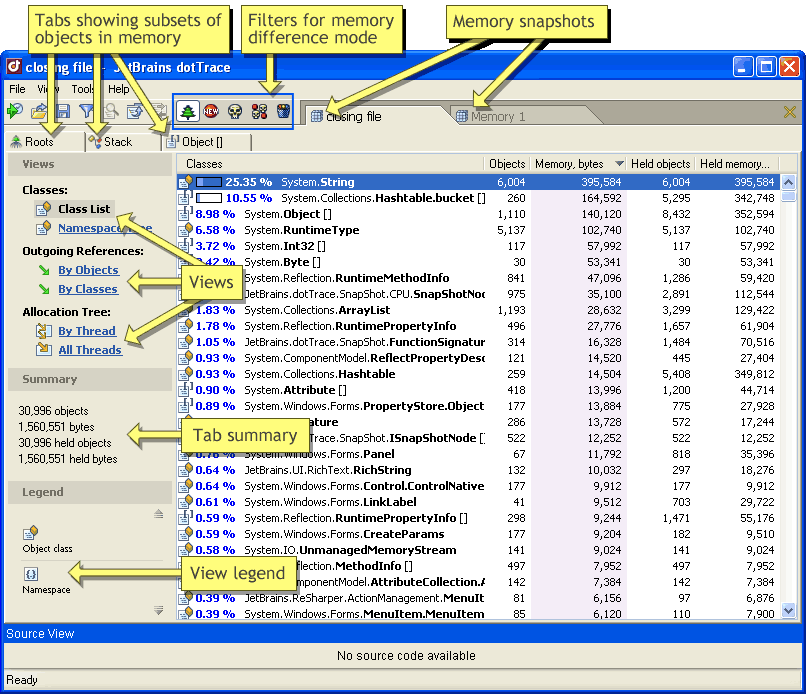
JetBrains dotTrace is a memory and performance profiler for .NET.
The screenshots I used in this article have been taken with dotTrace. This is also the tool I used the most for project X. I don't know the other .NET profilers well, but dotTrace provided me with the information I needed to solve the leaks detected in project X - more than 20 leaks so far... did I tell you that it's a big project?
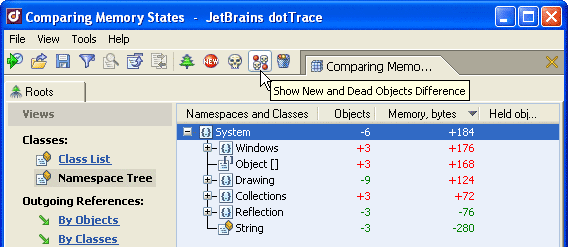
dotTrace allows you to identify which objects are in memory at a given moment in time, how they are kept alive (incoming references), and which objects each object keeps alive (outgoing references). You also get advanced debugging with allocations stack traces, the list of dead objects, etc.
Here is a view that allows you to see the differences between two memory states:
dotTrace is also a performance profiler:
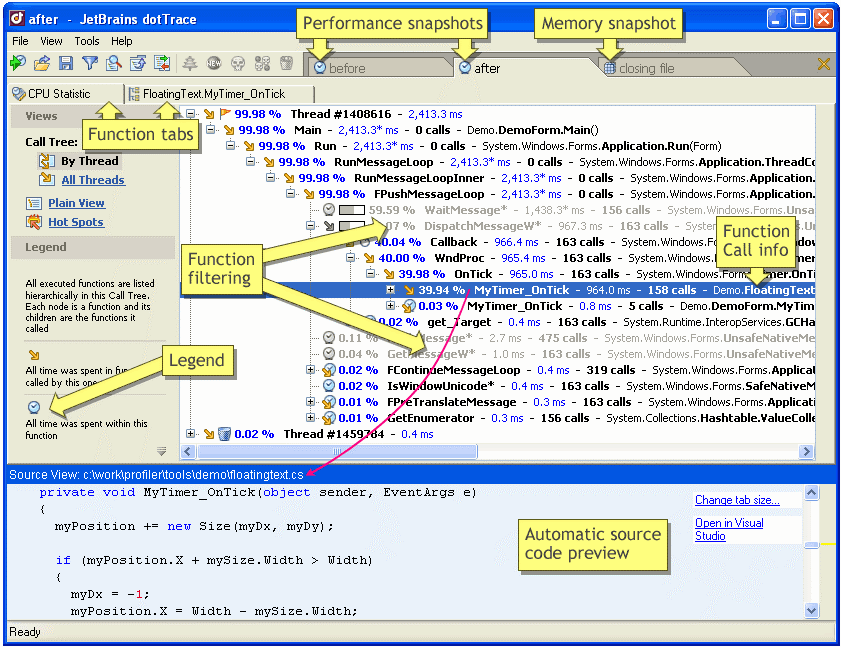
The way you use dotTrace, is by launching it first, then you ask it to profile your application by providing the path to the .EXE file.
If you want to inspect the memory used by your application, you can take snapshots while it's running and ask dotTrace to show you information. The first things you'll do are probably ask dotTrace to show you how many instances of a given class exist in memory, and how they are kept alive.
In addition to searching for managed instances, you can also search for unmanaged resources. dotTrace doesn't offer direct support for unmanaged resources tracking, but you can search for .NET wrapper objects. For example, you can see if you find instances of the Bitmap, Font or Brush classes. If you find an instance of such a class that hasn't been disposed, then the underlying system resource is still allocated to your application.
The next tool I'll present now offers built-in support for tracking unmanaged resources. This means that with it you'll be able to search directly for HBITMAP, HFONT or HBRUSH handles.
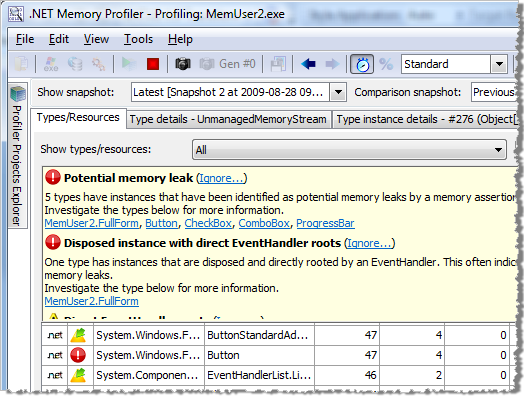
.NET Memory Profiler
.NET Memory Profiler is another interesting tool. Useful features it offers that you don't get with dotTrace include:
- View objects that have been disposed but are still alive
- View objects that have been released without having been disposed
- Unmanaged resources tracking
- Attach to a running process
- Attach to a process at the same time as Visual Studio's debugger
- Automatic memory analysis (tips and warnings regarding common memory usage issues)
Many .NET profilers are available
The above tools are just examples of what is available to help you. dotTrace and .NET Memory Profiler are two of the several memory (and performance) profilers available for .NET. Other big names include ANTS Profiler, YourKit Profiler, PurifyPlus, AQtime and CLR Profiler. Most of these tools offer the same kind of services as dotTrace. You'll find a whole set of tools dedicated to .NET profiling on SharpToolbox.com.
SOS.dll and WinDbg
Another tool you can use is SOS.dll. SOS.dll is a debugging extension that helps you debug managed programs in the WinDbg.exe debugger and in Visual Studio by providing information about the internal CLR (common language runtime) environment. SOS can be used to get information about the garbage collector, objects in memory, threads and locks, call stacks and more.
While it doesn't offer a user friendly graphical interface, SOS will allow you to do the things I've done above with dotTrace.
WinDbg is the tool you'll use most often when attaching to a process in production. You can learn more about SOS.dll and WinDBg on Rico Mariani's blog, on Mike Taulty's blog (SOS.dll with WinDbg and SOS.dll with Visual Studio), and on Wikipedia.
SOS.dll and WinDbg are provided free-of-charge by Microsoft as parts of the Debugging Tools for Windows package. One advantage of SOS.dll and WinDbg compared to the other tools I listed is their low resources consumption, while remaining powerful.
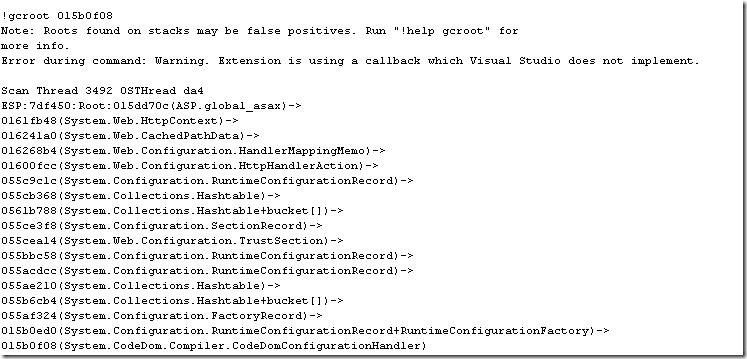
Sample output with sos.dll and the gcroot command:
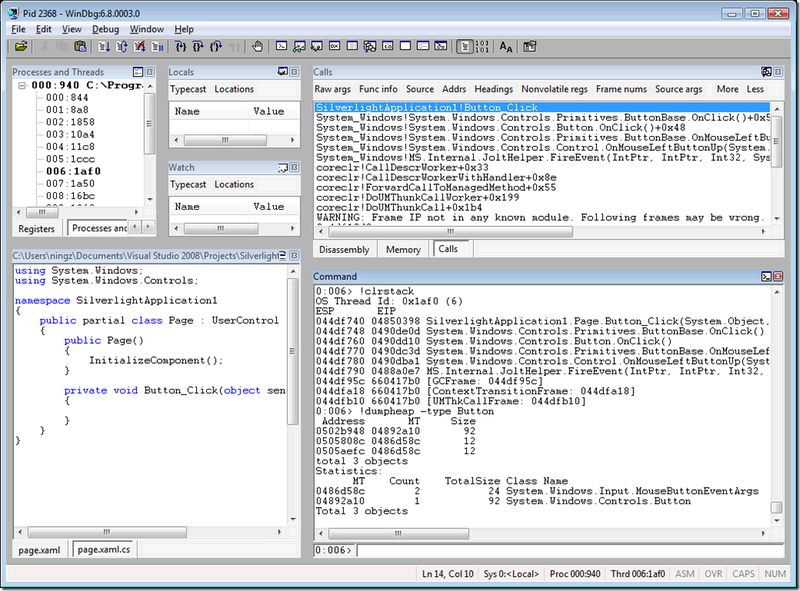
WinDbg screenshot:
Custom tooling
In addition to tools available on the market, don't forget that you can create your own tools. Those can be standalone tools that you'd reuse for several of your applications, but they can be a bit difficult to develop.
What we did for project X is develop integrated tools that help us keep track in real-time of resource usage and potential leaks.
One of these tools displays a list of alive and dead objects, right from the main application. It consists of a CAB service and a CAB view that can be used to check whether objects we expect to be released have indeed been released.
Here is a screenshot of this tooling:
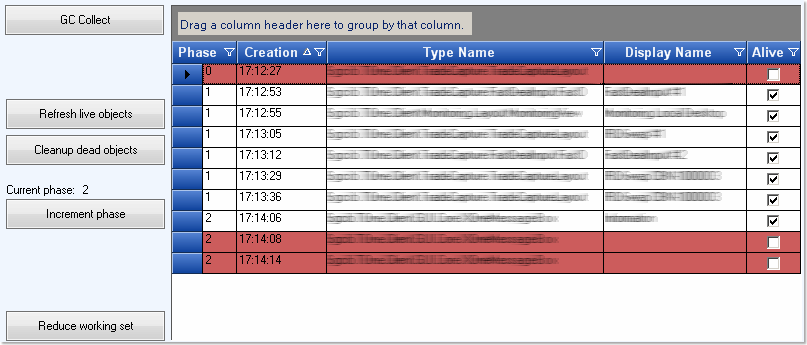
Keeping track of each object of the application would be too expensive and anti-productive given the number of objects involved in a large application. In fact, we don't keep an eye on all objects, but only on the high level objects and root containers of the application. Those are the objects I advised to track when I explained how to detect leaks.
The technique we used for creating this tool is quite simple. It uses weak references. The WeakReference class allows you to reference an object while still allowing that object to be reclaimed by garbage collection. In addition, it allows you to test whether the referenced object is dead or alive, via the IsAlive property.
In project X, we also have a widget that provides an overview of the GDI and User objects usage:
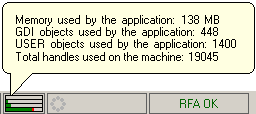
When resources are nearing exhaustion, the widget reports it with a warning sign:
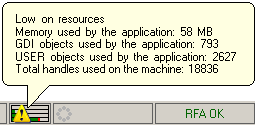
In addition, the application may ask the user to close some of the currently opened windows/tabs/documents, and prevent her/him from opening new ones, until the resources usage gets back below the critical level.
In order to read the current UI resources usage, we use the GetGuiResources function from User32.dll. Here is how we import it in C#:
// uiFlags: 0 - Count of GDI objects
// uiFlags: 1 - Count of USER objects
// GDI objects: pens, brushes, fonts, palettes, regions, device contexts, bitmaps, etc.
// USER objects: accelerator tables, cursors, icons, menus, windows, etc.
[DllImport("User32")]
extern public static int GetGuiResources(IntPtr hProcess, int uiFlags);

public static int GetGuiResourcesGDICount(Process process)
{
  return GetGuiResources(process.Handle, 0);
}

public static int GetGuiResourcesUserCount(Process process)
{
  return GetGuiResources(process.Handle, 1);
}
We retrieve the memory usage via the Process.GetCurrentProcess().WorkingSet64 property.
Conclusion
I hope that this article has provided you with a good base for improving your applications and for helping you solve leaks. Tracking leaks can be fun... if you don't have anything better to do with your time :-) Sometimes, however, you have no choice because solving leaks is vital for your application.
Once you have solved leaks, you still have work to do. I strongly advise you to improve your application so that it consumes as less resources as possible. Without losing functionality, of course. I invite you to read my recommendations at the end of this blog post.
Resources
The source code for the demonstration application is available for download.
Here are some interesting additional resources if you want to dig further:
- Jossef Goldberg: Finding memory leaks in WPF applications
- Tess Ferrandez has a series of posts about memory issues (ASP.NET, WinDbg, and more)
- MSDN article by Christophe Nasarre: Resource leaks: Detecting, locating, and repairing your leaky GDI code
- Article in French by Sami Jaber: Audit et analyse de fuites mémoire
- Article by Joydip Kanjilal: When and how to use Dispose and Finalize in C#
- CodeProject article by Shivprasad koirala: Detecting .NET application memory leaks (with PerfMon)
- My blog post about the Desktop Heap
- My blog post about lapsed listeners
- My blog post that shows how to force unsubscription from an event