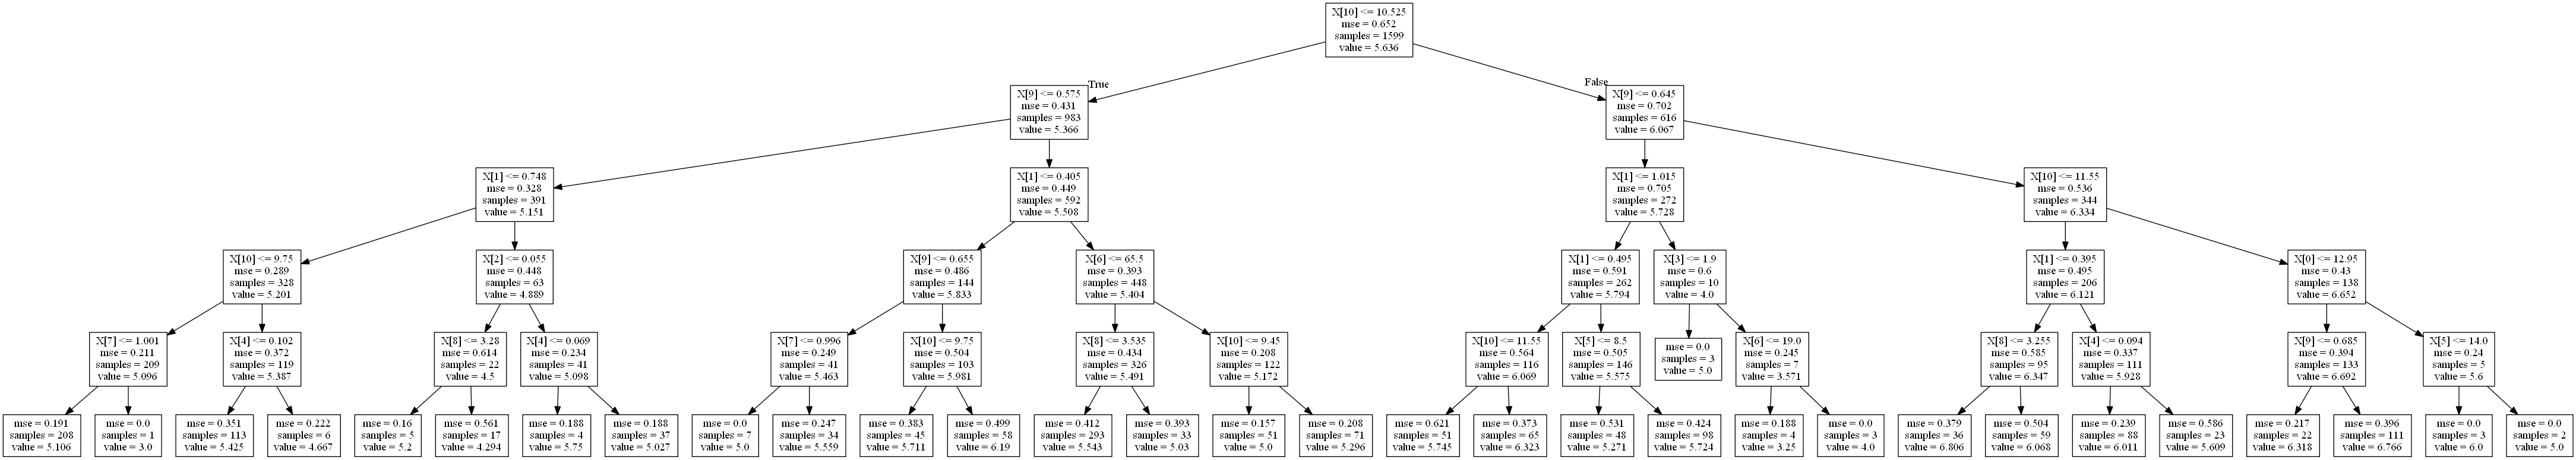
今天开始学习《Python机器学习:预测分析核心算法》的第六章:集成方法,并生成了第一个二元决策树。代码不难,如下:
 1 1 import numpy
 2  2 from sklearn import tree
 3  3 from sklearn.tree import DecisionTreeRegressor
 4  4 from sklearn.externals.six import StringIO
 5  5 from math import sqrt
 6  6 import matplotlib.pyplot as plot
 7  7
 8  8 #读取原数据,这里我将原数据已经从网上下载下来,用readlines()进行读取
 9  9 target_file= open('winequality-red.csv','r')
10 10 data = target_file.readlines()
11 11 target_file.close()
12 12
13 13 #将原数据中标题行(names)与数据行分开,并将数据行中属性(xList与labels)分开
14 14 xList = []
15 15 labels = []
16 16 names = []
17 17 #设置一个firstLine布尔型变量,设为True,在执行一遍for语句后即变为False
18 18 firstLine = True
19 19 for line in data:
20 20     if firstLine:
21 21         names = line.strip().split(";")
22 22         firstLine = False
23 23     else:
24 24         #分离数据行中的标签与属性
25 25         #split on semi-colon
26 26         row = line.strip().split(";")
27 27         #put labels in separate array
28 28         labels.append(float(row[-1]))
29 29         #remove label from row
30 30         row.pop()
31 31         #convert row to floats
32 32         floatRow = [float(num) for num in row]
33 33         xList.append(floatRow)
34 34
35 35 #获得数据行中属性(xList)一共多少行(nrows),和多少列(ncol)
36 36 nrows = len(xList)
37 37 ncols = len(xList[0])
38 38
39 39 wineTree = DecisionTreeRegressor(max_depth=5)
40 40
41 41 wineTree.fit(xList, labels)
42 42
43 43 with open("wineTree.dot", 'w') as f:
44 44     f = tree.export_graphviz(wineTree, out_file=f)
45 45 #Note: The code above exports the trained tree info to a Graphviz "dot" file.
46 46 #Drawing the graph requires installing GraphViz and the running the following on the command line
47 47 #dot -Tpng wineTree.dot -o wineTree.png
48 48 #注意最后三行的英文注释,这里提示需要安装GraphViz,而运行应该是在window的终端上了。
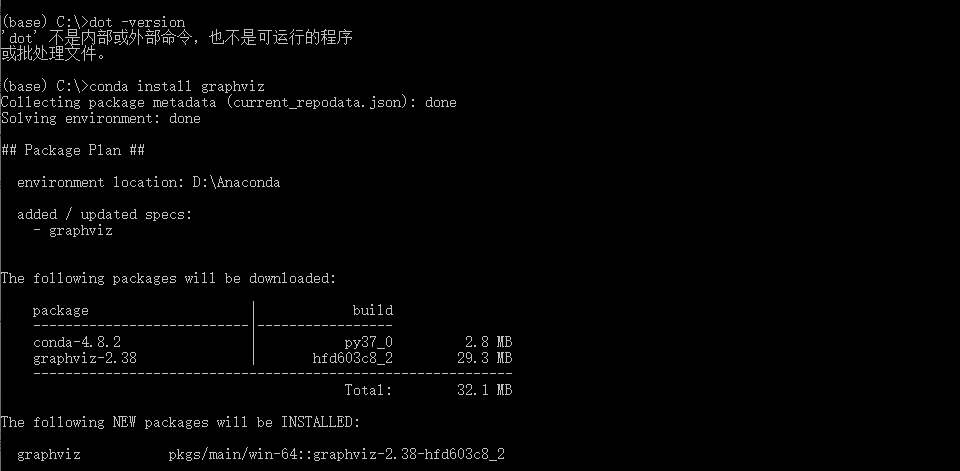
那么问题来了,如何安装GraphViz呢?网上找了好多教程,但前提是要去官网上下载2.3.8版本的msi文件,可官网下载速度太慢了,还好,我看到了下面这篇文章:科学网——python sklearn中graphviz安装介绍,这里感谢朱亚中博主。
我按照他的做法,在window终端中输入命令
conda install graphviz
pip install graphviz
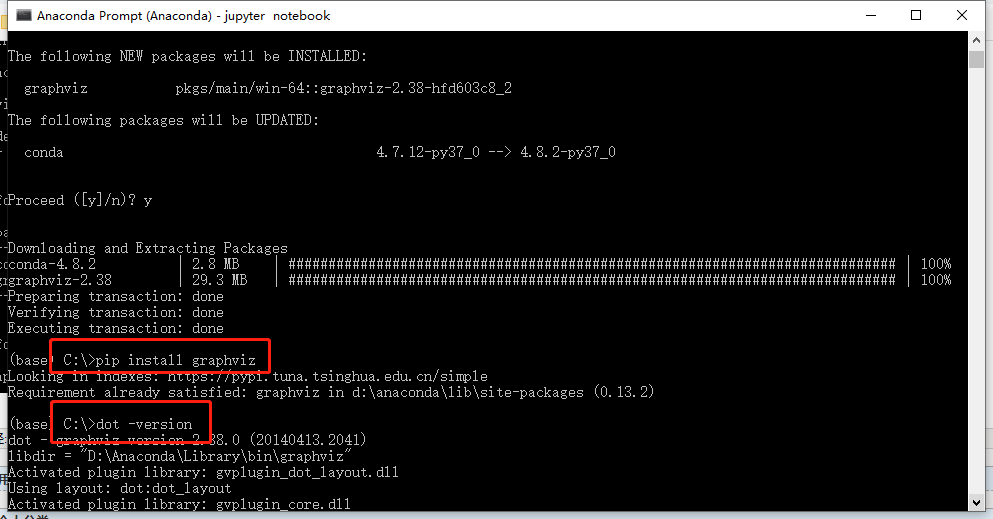
然后通过下面命令确认是否安装成功:
dot -version
最后,还是cd到wineTree.dot所在的文件下,在终端中输入命令:
dot -Tpng wineTree.dot -o wineTree.png
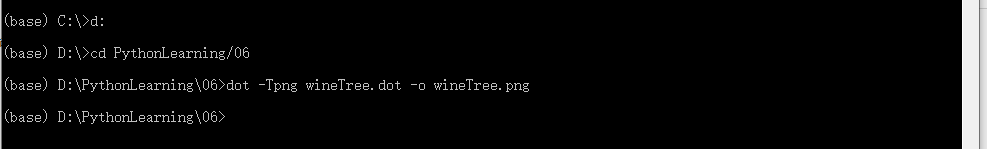
生成.png文件,如下图: