zoukankan      html  css  js  c++  java
  • echarts-detail---散点图

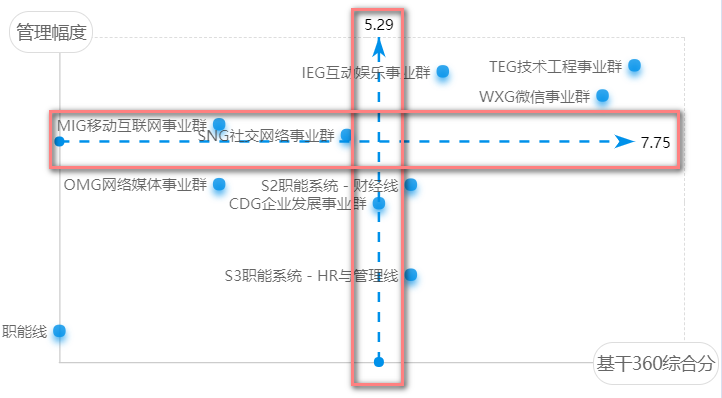
                            data4 = [{ xAxis: result.AvgEvaluate, seriesId: '6', name: '基干360综合分' },
                                    { yAxis: evalue, seriesId: '7',name: '管理幅度' }]
                                    // 特定线的值
                                data0 = {
                                    "name": item.OrganizationUnitName,
                                    "value": [
                                        item.EvaluateTotal ? (item.EvaluateTotal).toFixed(2) : '',
                                        item.Radio ? (item.Radio).toFixed(2) : ''
                                    ]
                                }//图中显示的值
                           var option = {
                            color: ['#082778', '#e4d426'],
                            legend: {
                                left: '60'
                            },
                            grid: {
                                left: '8%',
                                containLabel: true
                            },
                            // 数据被遮住,可设置此选项
                            tooltip: {
                                trigger: 'item',
                                // 只要是鼠标上移的效果,通过此选项进行设置(提示,线提示)
                                formatter: function (item) {
                                    if (!item.data.seriesId) { 
                                        if (item.data.formatValue === "LocationName") {
                                            return item.name + ' : ' + '(' + item.value[0] + "," + item.value[1] + "%" + ')';
                                        } else {
                                            return item.name + ' : ' + '(' + item.value + ')';
                                        }
                                    } else {
                                        if (item.data.seriesId === "1") {
                                            return (item.name+':'+item.value + '%')
                                        } else {
                                            return item.name + ':'+item.value
                                        }
                                    }
                                    
                                }
                            },
                            xAxis: [
                                {
                                    type: 'value',
                                    scale: true,//可以设置鼠标上移是否显示tool提示
                                    splitLine: {
                                        show: false
                                    },
                                    axisTick: {
                                        show: false
                                    },
                                    axisLabel: {
                                        show: false
                                    },
                                    axisLine: {
                                        lineStyle: {
                                            color: '#cccccc'
                                        }
                                    }
                                }
                            ],
                            yAxis: [
                                {
                                    type: 'value',
                                    scale: true,
                                    splitLine: {
                                        show: false
                                    },
                                    axisTick: {
                                        show: false
                                    },
                                    axisLabel: {
                                        show: false
                                    },
                                    axisLine: {
                                        lineStyle: {
                                            color: '#cccccc'
                                        }
                                    }
                                }
                            ],
                            series: [
                                {
                                    zlevel: 4,
                                    type: 'scatter',//散点图
                                    data: data1,
                                    label: {
                                        normal: {
                                            show: true,
                                            position: 'left',
                                            formatter: '{b}',
                                            color: "#3f3f3f"
                                        }
                                    },
                                    markLine: {// 另外标记的线(平均值、最大值、特定值)
                                        lineStyle: {
                                            normal: {
                                                type: 'dashed',
                                                 2
                                            }
                                        },
                                        //silent:true,
                                        data: data4,// 可以进行设置
                                        label: {
                                            normal: {
                                                position: 'end',
                                                formatter: function (item) { //标记线数值的格式
                                                    if (item.data.seriesId === "1") {
                                                        return (item.value + '%')
                                                    } else {
                                                        return item.value
                                                    }
                                                    
                                                },
                                                show: true
                                            },
                                            emphasis: {
                                                show: true,
                                                textStyle: {
                                                    fontSize: '14',
                                                    fontWeight: 'bold'
                                                },
                                                formatter: function (item) {
                                                    if (item.data.seriesId === "1") {
                                                        return (item.value + '%')
                                                    } else {
                                                        return item.value
                                                    }
    
                                                }
                                            }
                                        }
                                    },
                                    itemStyle: {
                                        emphasis: {
                                            opacity: 1
                                        },
                                        normal: {
                                            shadowBlur: 10,
                                            shadowColor: 'rgba(0, 145, 234, 1)',
                                            shadowOffsetY: 5,
                                            color: new echarts.graphic.RadialGradient(0.4, 0.3, 1, [{
                                                offset: 0,
                                                color: 'rgba(0, 145, 234, 1)'
                                            }, {
                                                offset: 1,
                                                color: 'rgba(0, 145, 234, 1)'
                                            }])
                                        }
                                    },
                                    emphasis: {
                                        label: {
                                            textStyle: {
                                                color: "#000",
                                                borderColor: "#fff",
                                                fontFamily: 'sans-serif',
                                                fontSize: 20,
                                                fontWeight: "normal"
                                            }
                                        }
                                    },
                                    markArea: {
                                        silent: true,
                                        itemStyle: {
                                            normal: {
                                                borderWidth: 1,
                                                borderType: 'dashed'
                                            }
                                        }
                                    }
                                }
                            ]
                        };
                        myChart.setOption(option)

    散点图
      1.如果数值被遮挡住,可设置grid选项值
      2.如果是显示特定的线,通过makeLine进行设置
      3.特定线的数值格式,可以通过label中的format进行设置
  • 相关阅读:
    Sudoku Solver [LeetCode]
    Populating Next Right Pointers in Each Node [LeetCode]
    Binary Tree Level Order Traversal [LeetCode]
    Clone Graph [LeetCode]
    Merge k Sorted Lists [LeetCode]
    Combinations [LeetCode]
    021 面向对象 一
    给图片加点料
    质数
    ex10 找出藏在字符串中的“密码”
  • 原文地址:https://www.cnblogs.com/jcxfighting/p/8029704.html
Copyright © 2011-2022 走看看