第一条是监控主节点和副本的健康状况,还有配置信息
1、primary_recovery_health_desc , secondary_recovery_health_desc 主要展示相关的服务是否在线
2、synchronization_health_desc 当前同步的状态
3、recovery_health_desc 判断当前同步组中的所有数据库是否都在同步中,如果展示为 ONLINE_IN_PROGRESS, 则说明在复制组中的某个数据库不在同步状态, 如果展示为 PROGRESS ,则说明在这个同步组中的所有数据库均在正常同步状态
大致上面的脚本是这样。
最后在说一下 RTO
Estimating failover time (RTO), 这个名词,其实就是要评估一下,如果我们的集群中的primary 失败,我们需要多长的时间进行failover
一个 failover 主要需要的时间是有以下几点组成的
主机失败的诊断和决策时间,进行数据的redo时间,以及最后的切换时间
SELECT
    ag.name AS 'GroupName'
   ,cs.replica_server_name AS 'Replica'
   ,rs.role_desc AS 'Role'
   ,ag.health_check_timeout as health_check_timeout_ms
   ,case ag.failure_condition_level
   when 1 then 'service down'
   when 2 then 'the server is out of control'
   when 3 then  'default value,or spin lock'
   when 4 then  'Please check your memory resource'
   when 5 then  'automatic failover'
   end as failure_condition_level
   ,REPLACE(ar.availability_mode_desc,'_',' ') AS 'AvailabilityMode'
   ,ags.primary_recovery_health_desc
   ,ags.secondary_recovery_health_desc
   ,ar.failover_mode_desc AS 'FailoverMode'
   ,rs.recovery_health_desc
   ,rs.synchronization_health_desc
   ,ar.seeding_mode_desc AS 'SeedingMode'
   ,ar.endpoint_url AS 'EndpointURL'
   ,al.dns_name AS 'Listener'
FROM sys.availability_groups ag
JOIN sys.dm_hadr_availability_group_states ags ON ag.group_id = ags.group_id
JOIN sys.dm_hadr_availability_replica_cluster_states cs ON ags.group_id = cs.group_id
JOIN sys.availability_replicas ar ON ar.replica_id = cs.replica_id
JOIN sys.dm_hadr_availability_replica_states rs  ON rs.replica_id = cs.replica_id
LEFT JOIN sys.availability_group_listeners al ON ar.group_id = al.group_id
下面这条脚本是看目前副本有多少日志还没有redo,redo_rate_in_mb是平均每秒的redo日志量,Tredo/M是预估大概还有多少分钟redo完。但是有一点,日志是在不断增加的,首先redo的速度是要大于日志新增的数据,不然不可能redo完。
redo_queue_size(KB/S),redo_rate secondary节点上做REDO的速率(KB/S)
SELECT
    ag.name AS 'GroupName'
    ,db_name(hst.database_id) as dbname
   ,cs.replica_server_name AS 'Replica'
   ,ag.health_check_timeout as health_check_timeout_ms
   ,cast(hst.redo_queue_size as float) / 1024 as redo_queue_size_in_mb
   ,hst.redo_rate/1024 as redo_rate_in_mb
   ,cast(hst.redo_queue_size as float) / hst.redo_rate as [Tredo/S]
   ,cast(hst.redo_queue_size as float) / hst.redo_rate / 60 as [Tredo/M]
   ,ags.primary_recovery_health_desc
   ,ags.secondary_recovery_health_desc
   ,ar.failover_mode_desc AS 'FailoverMode'
FROM sys.availability_groups ag
JOIN sys.dm_hadr_availability_group_states ags ON ag.group_id = ags.group_id
JOIN sys.dm_hadr_availability_replica_cluster_states cs ON ags.group_id = cs.group_id
Join sys.dm_hadr_database_replica_states as hst on ags.group_id = hst.group_id
JOIN sys.availability_replicas ar ON ar.replica_id = cs.replica_id
where hst.database_id = db_id('dbxxxxx') and ar.replica_metadata_id is not null and ags.primary_recovery_health is null
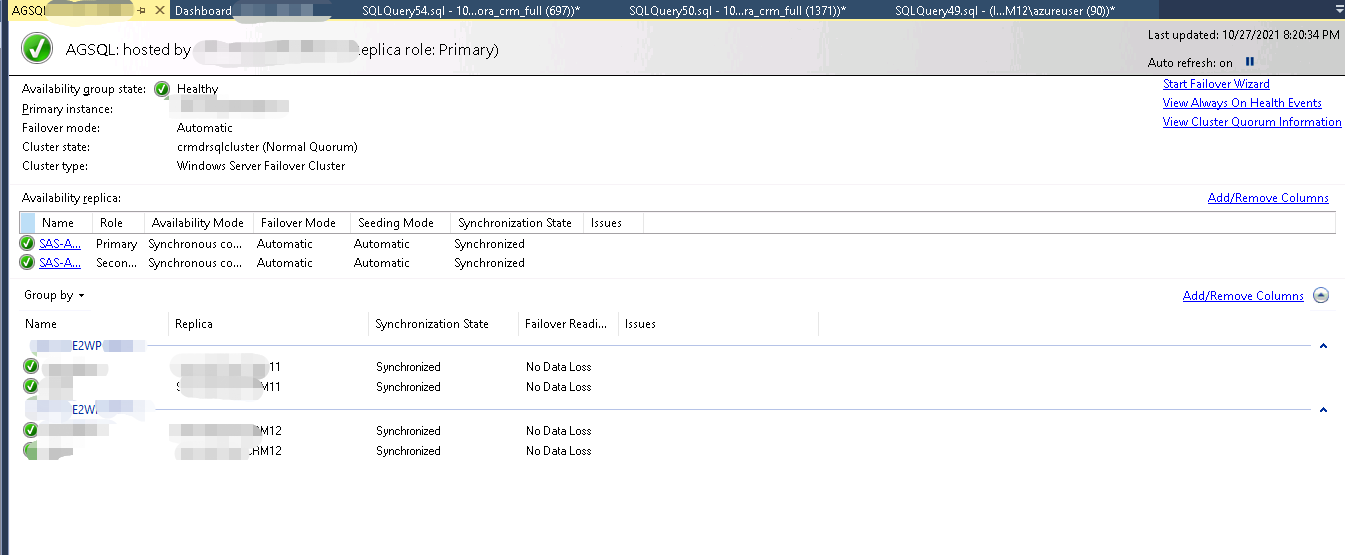
通过仪表板是比较直观的,但是这里看到Synchronized状态不代表数据就是同步了,这里只是告诉你,主节点的日志可以正常同步到副本,至于redo的延迟是不管的。所以只能说明连通性是ok的。
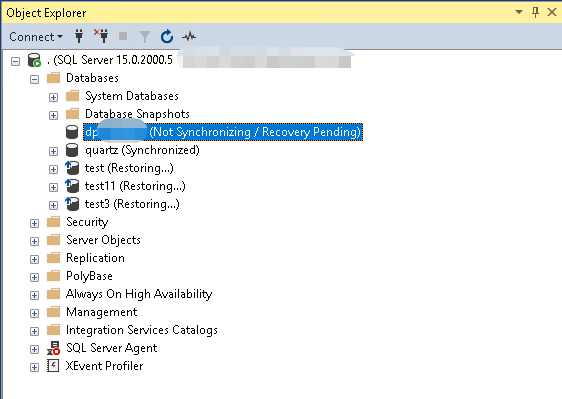
如果看到数据库处于Not Synchronizing的状态,说明高可用副本同步中断了。