Grafana v5.0的新功能
这是Grafana有史以来最重大的更新。 本文将详细介绍主要的新功能和增强功能。
- New Dashboard Layout Engine enables a much easier drag, drop and resize experience and new types of layouts.
● 新的仪表板布局引擎可以更轻松地拖放,调整体验和新类型的布局。
- New UX. The UI has big improvements in both look and function.
● 新UX。 用户界面在外观和功能上都有很大的改进。
- New Light Theme is now looking really nice.
- 新灯主题现在看起来非常好。
- Dashboard Folders helps you keep your dashboards organized.
- 仪表板文件夹可帮助您保持仪表板的有序。
- Permissions on folders and dashboards helps manage larger Grafana installations.
- 文件夹和仪表板上的权限有助于管理较大的Grafana安装。
- Group users into teams and use them in the new permission system.
- 将用户分组并在新的权限系统中使用它们。
- Datasource provisioning makes it possible to setup datasources via config files.
- 数据源配置使得可以通过配置文件设置数据源。
- Persistent dashboard url’s makes it possible to rename dashboards without breaking links.
- 持久性仪表板网址可以在不中断链接的情况下重命名仪表板。
- Graphite Tags & Integrated Function Docs.
- Graphite标签和集成功能文档。
Video showing new features
在官网上查看相关新功能动画
New Dashboard Layout Engine
新的仪表盘布局引擎
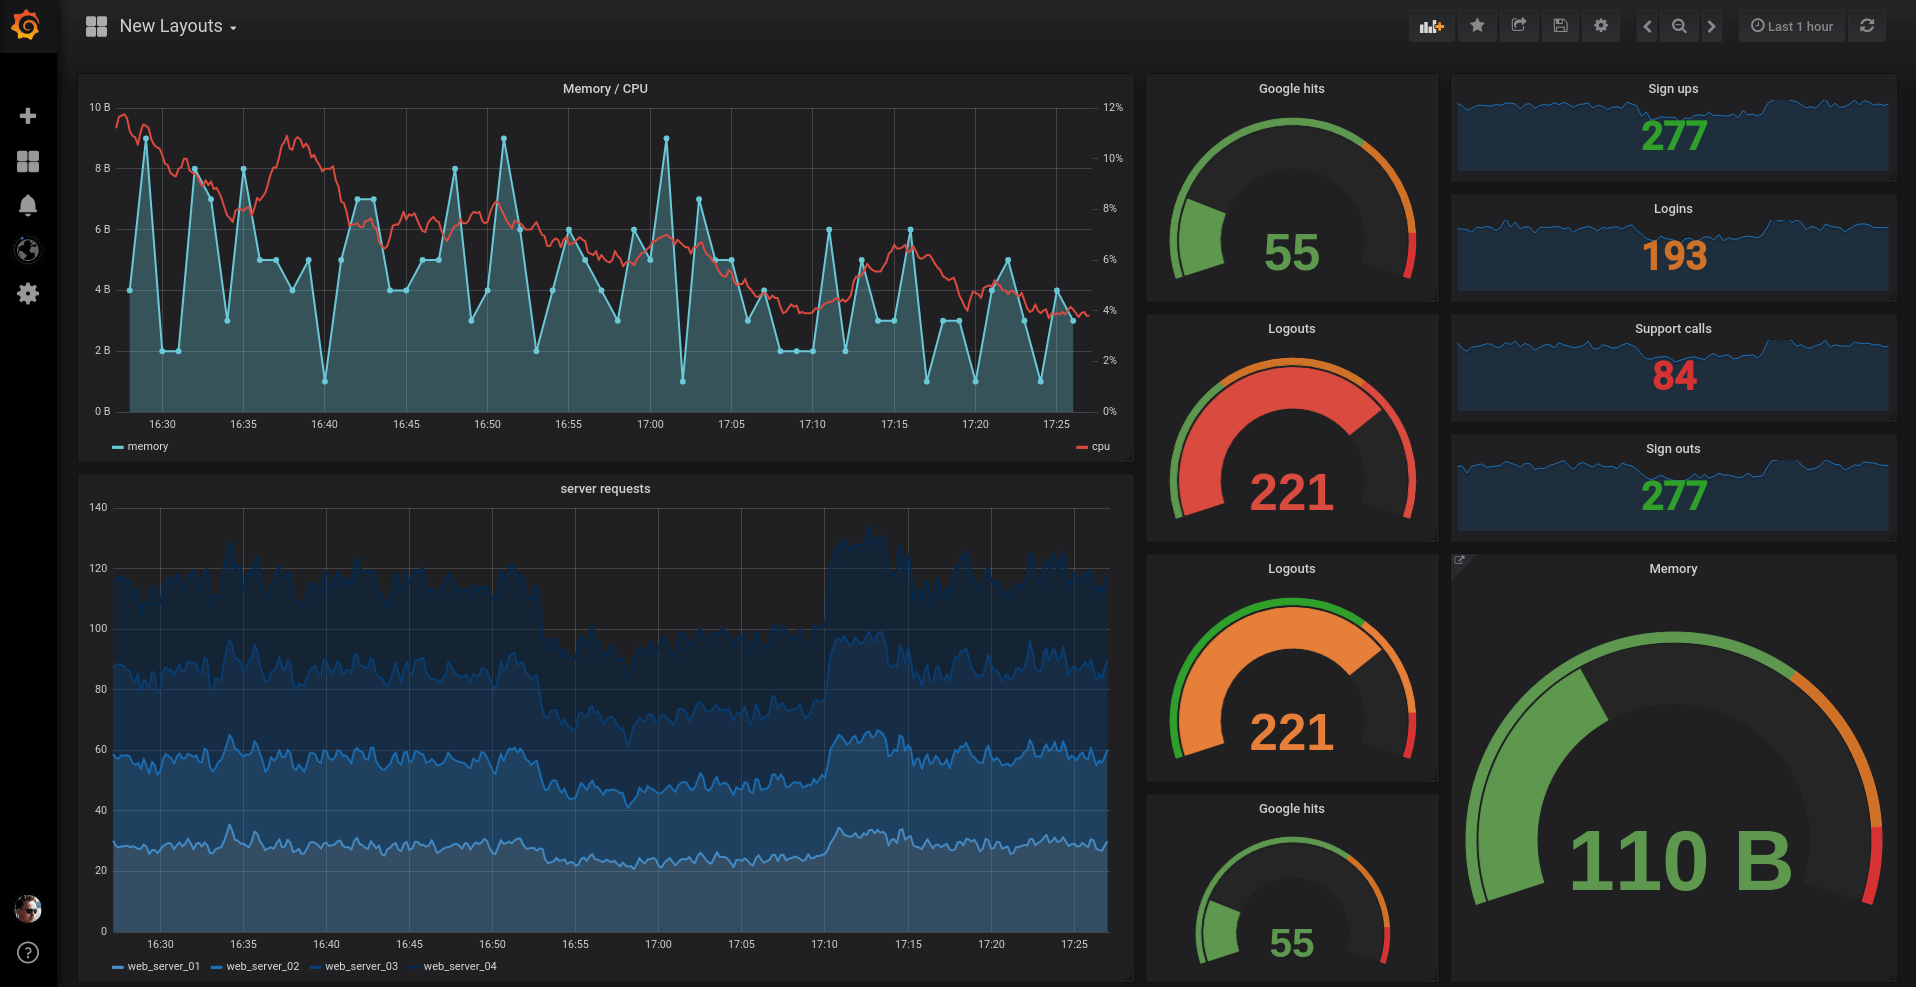
The new dashboard layout engine allows for much easier movement and sizing of panels, as other panels now move out of the way in a very intuitive way. Panels are sized independently, so rows are no longer necessary to create layouts. This opens up many new types of layouts where panels of different heights can be aligned easily. Checkout the new grid in the video above or on the play site. All your existing dashboards will automatically migrate to the new position system and look close to identical. The new panel position makes dashboards saved in v5.0 incompatible with older versions of Grafana.
新的仪表板布局引擎允许更轻松地移动和调整面板大小,因为其他面板现在以非常直观的方式移开。 面板的大小是独立的,因此不再需要行来创建布局。 这打开了很多新的布局类型,其中不同高度的面板可以轻松对齐。 在上面的视频或播放网站上签出新的网格。 你现有的所有仪表板都将自动迁移到新位置系统,并且看起来接近完全相同。 新的面板位置使保存在v5.0中的仪表板与早期版本的Grafana不兼容。
New UX

Almost every page has seen significant UX improvements. All pages (except dashboard pages) have a new tab-based layout that improves navigation between pages. The side menu has also changed quite a bit. You can still hide the side menu completely if you click on the Grafana logo.
几乎每个页面都看到了重大的UX改进。 所有页面(仪表板页面除外)都有一个新的基于选项卡的布局,可改善页面之间的导航。 侧面菜单也发生了很大变化。 如果您点击Grafana标记,你仍然可以完全隐藏侧面菜单。
Dashboard Settings
仪表板设置

Dashboard pages have a new header toolbar where buttons and actions are now all moved to the right. All the dashboard settings views have been combined with a side nav which allows you to easily move between different setting categories.
仪表板页面有一个新的标题栏,其中按钮和操作现在全部移动到右侧。 所有的仪表板设置视图已经与侧面导航相结合,可以让您轻松地在不同的设置类别之间移动。
New Light Theme
新亮度主题

This theme has not seen a lot of love in recent years and we felt it was time to give it a major overhaul. We are very happy with the result.
这个主题近年来都不太受我们待见,我们觉得是时候给它一个重大的改革。 我们对结果非常满意。
Dashboard Folders
仪表板文件夹
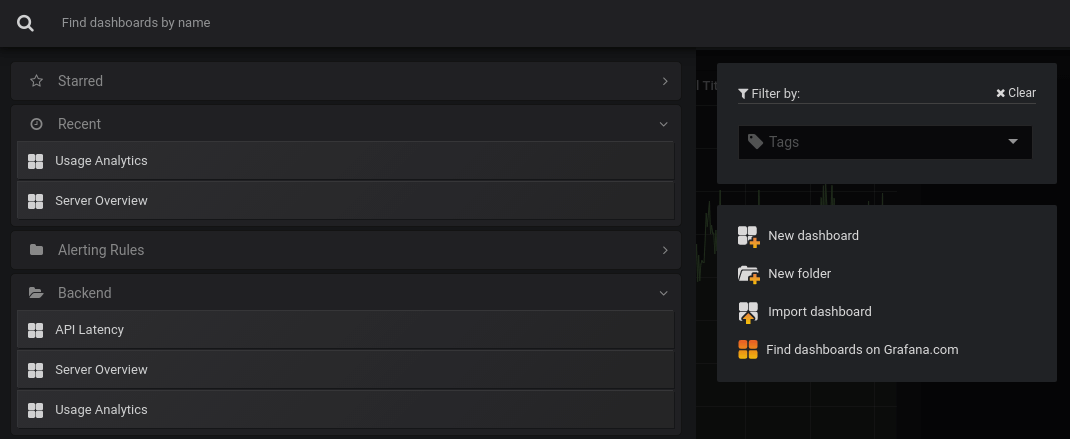
The big new feature that comes with Grafana v5.0 is dashboard folders. Now you can organize your dashboards in folders, which is very useful if you have a lot of dashboards or multiple teams.
Grafana v5.0附带的新功能是仪表板文件夹。 现在我们可以将我们的仪表盘整理到文件夹中,在我们有很多仪表盘或多个团队,这非常有用。
- New search design adds expandable sections for each folder, starred and recently viewed dashboards.
- 新的搜索设计为每个文件夹,加星标和最近查看的仪表板添加了可扩展部分
- New manage dashboard pages enable batch actions and views for folder settings and permissions.
- 新的管理仪表板页面为文件夹设置和权限启用批处理操作和视图。
- Set permissions on folders and have dashboards inherit the permissions.
设置文件夹权限并让仪表板继承权限。
Teams
小组
A team is a new concept in Grafana v5. They are simply a group of users that can be used in the new permission system for dashboards and folders. Only an admin can create teams. We hope to do more with teams in future releases like integration with LDAP and a team landing page.
一个团队是Grafana v5中的一个新概念。 它们是简单的一组可用于仪表盘和文件夹新权限系统的用户。 只有管理员可以创建团队。 我们希望在未来的版本中与团队一起做更多的事情,例如与LDAP集成和团队着陆页。
Permissions
权限
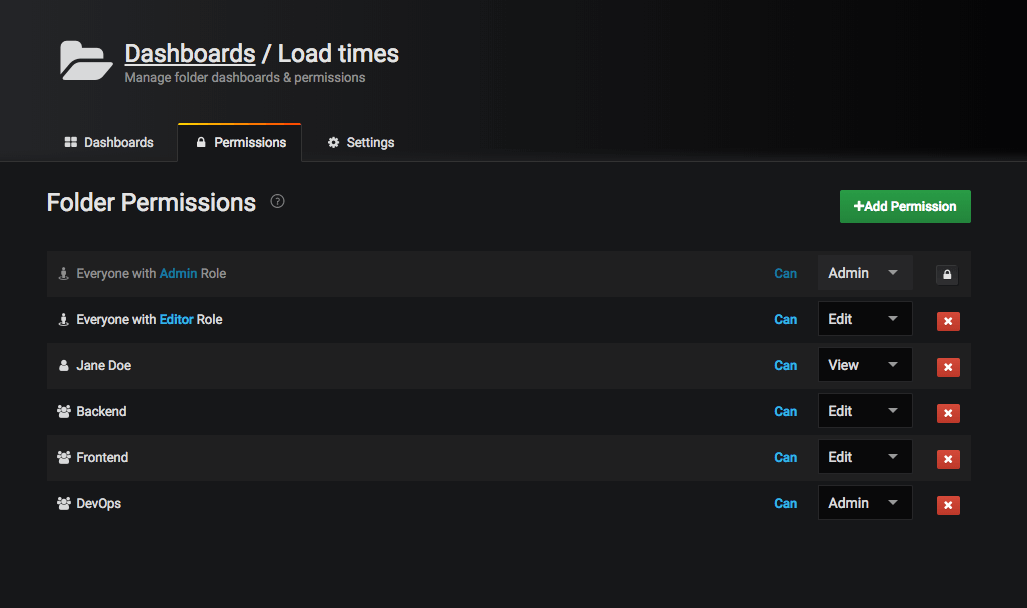
You can assign permissions to folders and dashboards. The default user role-based permissions can be removed and replaced with specific teams or users enabling more control over what a user can see and edit.
您可以为文件夹和仪表板分配权限。可以删除默认的基于用户角色的权限,并替换为特定的团队或用户,以更好地控制用户可以查看和编辑的内容。
Dashboard permissions only limits what dashboards & folders a user can view & edit not which data sources a user can access nor what queries a user can issue.
仪表板权限仅限制用户可以查看和编辑哪些仪表板和文件夹,而不是用户可以访问哪些数据源以及用户可以发出什么查询。
Provisioning from configuration
从配置文件配置
In previous versions of Grafana, you could only use the API for provisioning data sources and dashboards. But that required the service to be running before you started creating dashboards and you also needed to set up credentials for the HTTP API. In v5.0 we decided to improve this experience by adding a new active provisioning system that uses config files. This will make GitOps more natural as data sources and dashboards can be defined via files that can be version controlled. We hope to extend this system to later add support for users, orgs and alerts as well.
在之前的Grafana版本中,您只能使用API来配置数据源和仪表板。但是,这需要在开始创建仪表板之前运行该服务,并且还需要为HTTP API设置凭据。在v5.0中,我们决定通过添加一个使用配置文件的新主动配置系统来改善这种体验。这将使GitOps更加自然,因为数据源和仪表板可以通过可以版本控制的文件来定义。我们希望扩展这个系统,以便稍后添加对用户,组织和警报的支持。
Data sources
数据源
Data sources can now be setup using config files. These data sources are by default not editable from the Grafana GUI. It’s also possible to update and delete data sources from the config file. More info in the data source provisioning docs.
数据源现在可以使用配置文件进行设置。这些数据源在默认情况下不能从Grafana GUI进行编辑。也可以从配置文件更新和删除数据源。数据源配置文档中的更多信息。
Dashboards
仪表板
We also deprecated the [dashboard.json] in favor of our new dashboard provisioner that keeps dashboards on disk in sync with dashboards in Grafana’s database. The dashboard provisioner has multiple advantages over the old [dashboard.json] feature. Instead of storing the dashboard in memory we now insert the dashboard into the database, which makes it possible to star them, use one as the home dashboard, set permissions and other features in Grafana that expects the dashboards to exist in the database. More info in the dashboard provisioning docs
我们还弃用了[dashboard.json],转而使用我们的新仪表板配置程序,该仪表板配置程序使仪表板磁盘上的数据与Grafana数据库中的仪表板保持同步。与旧的[dashboard.json]功能相比,仪表板配置器具有多种优势。我们现在不将仪表板存储在内存中,而是将仪表板插入到数据库中,这样就可以将它们加上星号,将其用作主页仪表板,在Grafana中设置权限和其他功能,以期望仪表板存在于数据库中。仪表板配置文档中的更多信息查看提供的文档
Graphite Tags & Integrated Function Docs
Graphite标签和集成功能文档

The Graphite query editor has been updated to support the latest Graphite version (v1.2) that adds many new functions and support for querying by tags. You can now also view function documentation right in the query editor!
Graphite查询编辑器已更新为支持最新的Graphite版本(v1.2),该版本添加了许多新功能并支持通过标签进行查询。 您现在也可以在查询编辑器中查看功能文档了!
阅读关于Graphite Tag支持的更多信息。
Dashboard model, persistent url’s and API changes
仪表板模型,持久性URL和API更改
We are introducing a new unique identifier (uid) in the dashboard JSON model. It’s automatically generated if not provided when creating a dashboard and will have a length of 9-12 characters.
我们在仪表板JSON模型中引入了一个新的唯一标识符(uid)。 如果创建仪表板时未自动生成,并且长度为9-12个字符。
The unique identifier allows having persistent URL’s for accessing dashboards, sharing them between instances and when using dashboard provisioning. This means that dashboard can be renamed without breaking any links. We’re changing the url format for dashboards from /dashboard/db/:slug to /d/:uid/:slug. We’ll keep supporting the old slug-based url’s for dashboards and redirects to the new one for backward compatibility. Please note that the old slug-based url’s have been deprecated and will be removed in a future release.
唯一标识符允许拥有用于访问仪表板的持久性URL,在实例之间和使用仪表板供应时共享它们。 这意味着仪表板可以重命名而不会破坏任何链接。 我们正在将仪表板的网址格式从/ dashboard / db /:slug更改为/ d /:uid /:slug。 我们将继续支持旧的基于slug的网址的仪表板和重定向到新的向后兼容性。 请注意,旧的基于slug的url已被弃用,并将在未来的版本中删除。
Sharing dashboards between instances becomes much easier since the uid is unique (unique enough). This might seem like a small change, but we are incredibly excited about it since it will make it much easier to manage, collaborate and navigate between dashboards.
在实例之间共享仪表板变得容易得多,因为uid是唯一的(足够独特)。 这看起来可能只是一个小小的改变,但我们对它感到非常兴奋,因为它将使它在仪表板之间的管理,协作和导航变得更容易。
API changes
API改变
New uid-based routes in the dashboard API have been introduced to retrieve and delete dashboards. The corresponding slug-based routes have been deprecated and will be removed in a future release.
已引入仪表板API中新的基于uid的路线以检索和删除仪表板。 相应的基于段落的路线已被弃用,并将在未来版本中删除。