zoukankan      html  css  js  c++  java
  • highcharts

    简单条形图用法:

    1 <script src="https://img.hcharts.cn/jquery/jquery-1.8.3.min.js"></script>
    2 <script src="https://img.hcharts.cn/highcharts/highcharts.js"></script>

    图的容器:

    1 <div id="container" style="min-400px;height:400px"></div>

    js代码:

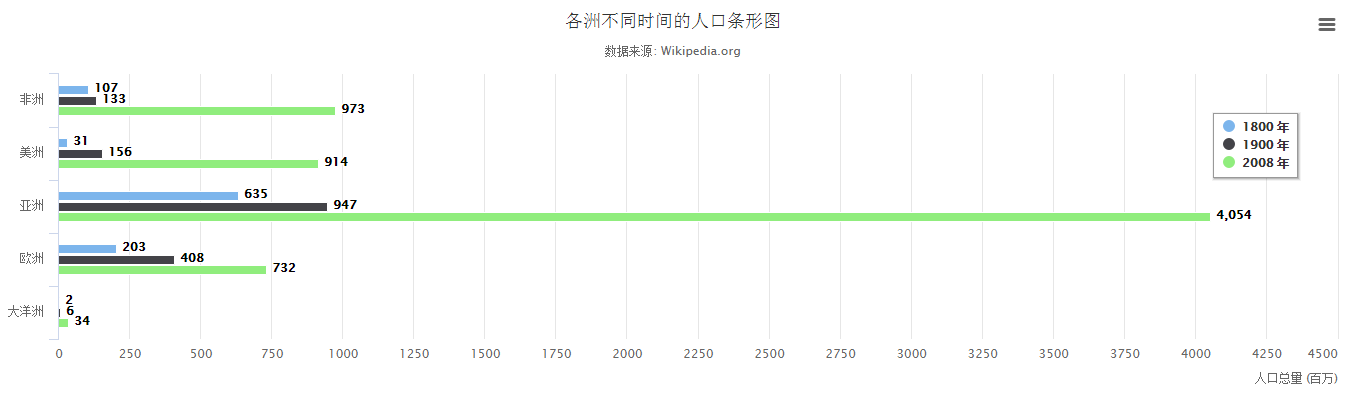
     1 <script>
     2     $(function () {
     3     $('#container').highcharts({
     4         chart: {
     5             type: 'bar'
     6         },
     7         title: {
     8             text: '各洲不同时间的人口条形图'
     9         },
    10         subtitle: {
    11             text: '数据来源: Wikipedia.org'
    12         },
    13         xAxis: {
    14             categories: ['非洲', '美洲', '亚洲', '欧洲', '大洋洲'],
    15             title: {
    16                 text: null
    17             }
    18         },
    19         yAxis: {
    20             min: 0,
    21             title: {
    22                 text: '人口总量 (百万)',
    23                 align: 'high'
    24             },
    25             labels: {
    26                 overflow: 'justify'
    27             }
    28         },
    29         tooltip: {
    30             valueSuffix: ' 百万'
    31         },
    32         plotOptions: {
    33             bar: {
    34                 dataLabels: {
    35                     enabled: true,
    36                     allowOverlap: true
    37                 }
    38             }
    39         },
    40         legend: {
    41             layout: 'vertical',
    42             align: 'right',
    43             verticalAlign: 'top',
    44             x: -40,
    45             y: 100,
    46             floating: true,
    47             borderWidth: 1,
    48             backgroundColor: ((Highcharts.theme && Highcharts.theme.legendBackgroundColor) || '#FFFFFF'),
    49             shadow: true
    50         },
    51         credits: {
    52             enabled: false
    53         },
    54         series: [{
    55             name: '1800 年',
    56             data: [107, 31, 635, 203, 2]
    57         }, {
    58             name: '1900 年',
    59             data: [133, 156, 947, 408, 6]
    60         }, {
    61             name: '2008 年',
    62             data: [973, 914, 4054, 732, 34]
    63         }]
    64     });
    65 });
    66 </script>

    效果:

  • 相关阅读:
    Angularjs演示Service功能
    初始化应用程序数据ng-init指令
    AngularJs的ng-include的使用与实现
    把视图转换为字符串
    学习angularjs的内置API函数
    AngularJs自定义过滤器filter
    ASP.NET MVC的切片(Section)脚本(script)
    在ASP.NET MVC部署AngularJs
    MS SQL的某一数据库成了Single User模式
    AngularJs的MVC模式
  • 原文地址:https://www.cnblogs.com/jonney-wang/p/7290911.html
Copyright © 2011-2022 走看看