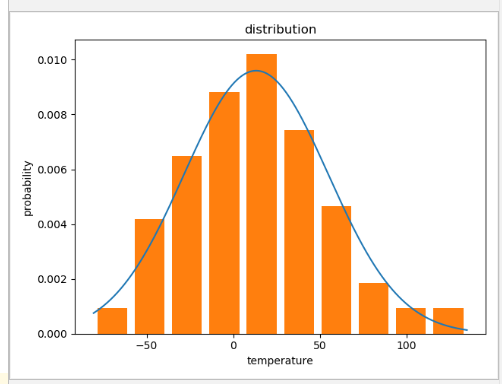
1、生成正态分布数据并绘制概率分布图
import pandas as pd
import numpy as np
import matplotlib.pyplot as plt


# 根据均值、标准差,求指定范围的正态分布概率值
def normfun(x, mu, sigma):
    pdf = np.exp(-((x - mu)**2)/(2*sigma**2)) / (sigma * np.sqrt(2*np.pi))
    return pdf


# result = np.random.randint(-65, 80, size=100)  # 最小值,最大值,数量
result = np.random.normal(15, 44, 100)  # 均值为0.5,方差为1
print(result)

x = np.arange(min(result), max(result), 0.1)
# 设定 y 轴,载入刚才的正态分布函数
print(result.mean(), result.std())
y = normfun(x, result.mean(), result.std())
plt.plot(x, y)  # 这里画出理论的正态分布概率曲线

# 这里画出实际的参数概率与取值关系
plt.hist(result, bins=10, rwidth=0.8, density=True)  # bins个柱状图,宽度是rwidth(0~1),=1没有缝隙
plt.title('distribution')
plt.xlabel('temperature')
plt.ylabel('probability')
# 输出
plt.show()  # 最后图片的概率和不为1是因为正态分布是从负无穷到正无穷,这里指截取了数据最小值到最大值的分布

根据范围生成正态分布:
result = np.random.randint(-65, 80, size=100) # 最小值,最大值,数量
根据均值、方差生成正态分布:
result = np.random.normal(15, 44, 100) # 均值为0.5,方差为1
2、判断一个序列是否符合正态分布
import numpy as np
from scipy import stats


pts = 1000
np.random.seed(28041990)
a = np.random.normal(0, 1, size=pts)  # 生成1个正态分布,均值为0,标准差为1,100个点
b = np.random.normal(2, 1, size=pts)  # 生成1个正态分布,均值为2,标准差为1, 100个点
x = np.concatenate((a, b))  # 把两个正态分布连接起来,所以理论上变成了非正态分布序列
k2, p = stats.normaltest(x)
alpha = 1e-3
print("p = {:g}".format(p))


# 原假设:x是一个正态分布
if p < alpha:  # null hypothesis: x comes from a normal distribution
    print("The null hypothesis can be rejected")  # 原假设可被拒绝,即不是正态分布
else:
    print("The null hypothesis cannot be rejected")  # 原假设不可被拒绝,即使正态分布
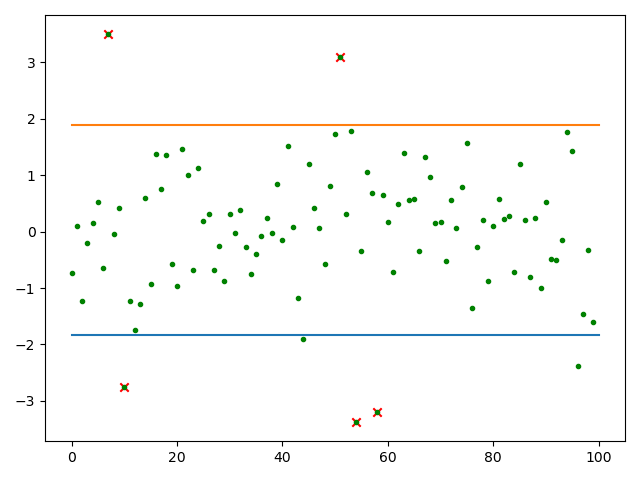
3、求置信区间、异常值
import numpy as np
import matplotlib.pyplot as plt
from scipy import stats
import pandas as pd


# 求列表数据的异常点
def get_outer_data(data_list):
    df = pd.DataFrame(data_list, columns=['value'])
    df = df.iloc[:, 0]
    # 计算下四分位数和上四分位
    Q1 = df.quantile(q=0.25)
    Q3 = df.quantile(q=0.75)

    # 基于1.5倍的四分位差计算上下须对应的值
    low_whisker = Q1 - 1.5 * (Q3 - Q1)
    up_whisker = Q3 + 1.5 * (Q3 - Q1)

    # 寻找异常点
    kk = df[(df > up_whisker) | (df < low_whisker)]
    data1 = pd.DataFrame({'id': kk.index, '异常值': kk})
    return data1


N = 100
result = np.random.normal(0, 1, N)
# result = np.random.randint(-65, 80, size=N)  # 最小值,最大值,数量
mean, std = result.mean(), result.std(ddof=1)  # 求均值和标准差

# 计算置信区间,这里的0.9是置信水平
conf_intveral = stats.norm.interval(0.9, loc=mean, scale=std)  # 90%概率
print('置信区间:', conf_intveral)

x = np.arange(0, len(result), 1)

# 求异常值
outer = get_outer_data(result)
print(outer, type(outer))
x1 = outer.iloc[:, 0]
y1 = outer.iloc[:, 1]
plt.scatter(x1, y1, marker='x', color='r')  # 所有离散点
plt.scatter(x, result, marker='.', color='g')  # 异常点
plt.plot([0, len(result)], [conf_intveral[0], conf_intveral[0]])
plt.plot([0, len(result)], [conf_intveral[1], conf_intveral[1]])
plt.show()

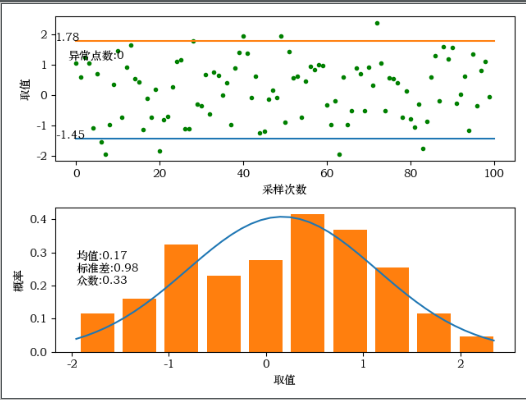
4、采样点离散图和概率图
import numpy as np
import matplotlib.pyplot as plt
from scipy import stats
import pandas as pd
import time


print(time.strftime('%Y-%m-%D %H:%M:%S'))


# 根据均值、标准差,求指定范围的正态分布概率值
def _normfun(x, mu, sigma):
    pdf = np.exp(-((x - mu)**2)/(2*sigma**2)) / (sigma * np.sqrt(2*np.pi))
    return pdf


# 求列表数据的异常点
def get_outer_data(data_list):
    df = pd.DataFrame(data_list, columns=['value'])
    df = df.iloc[:, 0]
    # 计算下四分位数和上四分位
    Q1 = df.quantile(q=0.25)
    Q3 = df.quantile(q=0.75)

    # 基于1.5倍的四分位差计算上下须对应的值
    low_whisker = Q1 - 1.5 * (Q3 - Q1)
    up_whisker = Q3 + 1.5 * (Q3 - Q1)

    # 寻找异常点
    kk = df[(df > up_whisker) | (df < low_whisker)]
    data1 = pd.DataFrame({'id': kk.index, '异常值': kk})
    return data1


N = 100
result = np.random.normal(0, 1, N)
# result = np.random.randint(-65, 80, size=N)  # 最小值,最大值,数量
# result = [100]*100  # 取值全相同
# result = np.array(result)
mean, std = result.mean(), result.std(ddof=1)  # 求均值和标准差
# 计算置信区间,这里的0.9是置信水平
if std == 0:  # 如果所有值都相同即标准差为0则无法计算置信区间
    conf_intveral = [min(result)-1, max(result)+1]
else:
    conf_intveral = stats.norm.interval(0.9, loc=mean, scale=std)  # 90%概率
# print('置信区间:', conf_intveral)
# 求异常值
outer = get_outer_data(result)
# 绘制离散图
fig = plt.figure()
fig.add_subplot(2, 1, 1)
plt.subplots_adjust(hspace=0.3)
x = np.arange(0, len(result), 1)
plt.scatter(x, result, marker='.', color='g')  # 画所有离散点
plt.scatter(outer.iloc[:, 0], outer.iloc[:, 1], marker='x', color='r')  # 画异常离散点
plt.plot([0, len(result)], [conf_intveral[0], conf_intveral[0]])  # 置信区间线条
plt.plot([0, len(result)], [conf_intveral[1], conf_intveral[1]])  # 置信区间线条
plt.text(0, conf_intveral[0], '{:.2f}'.format(conf_intveral[0]))  # 置信区间数字显示
plt.text(0, conf_intveral[1], '{:.2f}'.format(conf_intveral[1]))  # 置信区间数字显示
info = 'outer count:{}'.format(len(outer.iloc[:, 0]))
plt.text(min(x), max(result)-((max(result)-min(result)) / 2), info)  # 异常点数显示
plt.xlabel('sample count')
plt.ylabel('value')
# 绘制概率图
if std != 0:  # 如果所有取值都相同
    fig.add_subplot(2, 1, 2)
    x = np.arange(min(result), max(result), 0.1)
    y = _normfun(x, result.mean(), result.std())
    plt.plot(x, y)  # 这里画出理论的正态分布概率曲线
    plt.hist(result, bins=10, rwidth=0.8, density=True)  # bins个柱状图,宽度是rwidth(0~1),=1没有缝隙
    info = 'mean:{:.2f}
std:{:.2f}
mode num:{:.2f}'.format(mean, std, np.median(result))
    plt.text(min(x), max(y) / 2, info)
    plt.xlabel('value')
    plt.ylabel('Probability')
else:
    fig.add_subplot(2, 1, 2)
    info = 'non-normal distribution!!
mean:{:.2f}
std:{:.2f}
mode num:{:.2f}'.format(mean, std, np.median(result))
    plt.text(0.5, 0.5, info)
    plt.xlabel('value')
    plt.ylabel('Probability')
plt.savefig('./distribution.jpg')
plt.show()

print(time.strftime('%Y-%m-%D %H:%M:%S'))
