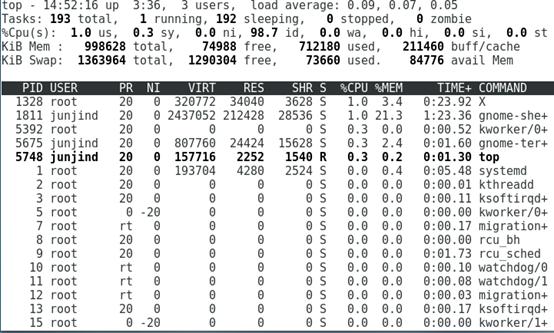
使用top命令,实时查看后台的进程,会看到以下信息
官方的解释:
us: user cpu time (or) % CPU time spent in user space
sy: system cpu time (or) % CPU time spent in kernel space
ni: user nice cpu time (or) % CPU time spent on low priority processes
id: idle cpu time (or) % CPU time spent idle
wa: io wait cpu time (or) % CPU time spent in wait (on disk)
hi: hardware irq (or) % CPU time spent servicing/handling hardware interrupts
si: software irq (or) % CPU time spent servicing/handling software interrupts
st: steal time - - % CPU time in involuntary wait by virtual cpu while hypervisor is servicing another processor (or) % CPU time stolen from a virtual machine
us:用户进程 sy:系统进程 id:剩余多少CPU wa: 有多少在等待CPU,>0表示 系统在进行io操作
hi: 硬件中断 si: 软件中断 st: CPU被偷走的百分比(我们安装虚拟机就是这个道理)
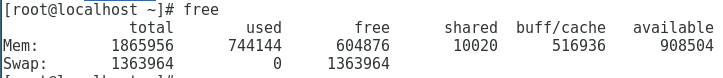
swap交换分区,开始使用,说明内存不够用
PID:进程号 PR NI 结合起来用,控制进程的优先级
VIRT:虚拟内存 RES: 物理内存 SHR:共享内存 S: 进程运行状态
-------在top命令下,按1,可以查看有几个CPU,以及CPU的详细信息
僵尸进程:父进程已被关闭,子进程并没有被关闭,还存在在内存中,但是并没有干活,所以为僵尸进程。
使用free 进行内存查看
使用ps aux 查看所有进程
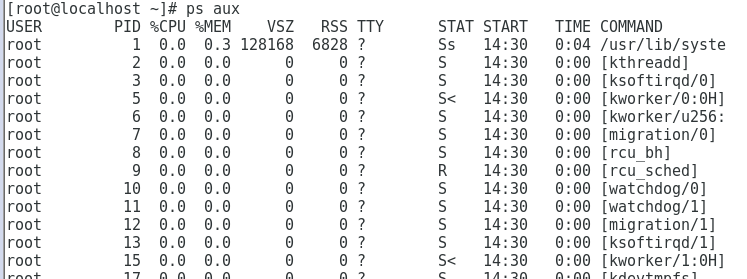
这里介绍一个grep命令,过滤作用,可以只看自己想看的进程
ps aux | grep 'init' 只会看到包含init的进程信息
ps aux | grep 'init' | grep -v 'grep' 只会看到包含init的不包含grep的进程信息

kill -9 pid/%工作号:强制回收进程

kill -9 进程名:会回收所有该名字的进程
-------pgrep 命令,可以快速查看进程pid
pstree 用来查看进程树