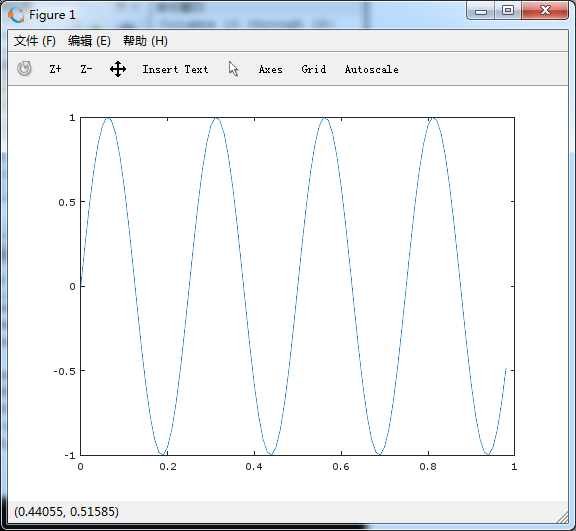
>> t=[0:0.01:0.98];
>> y1 = sin(2*pi*4*t);
>> plot(t,y1);
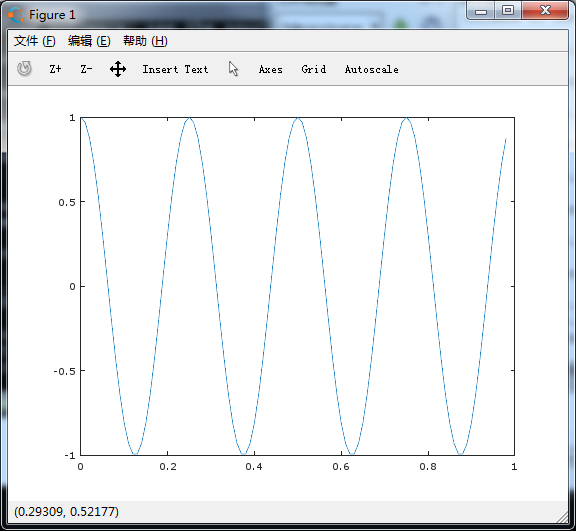
>> y2 = cos(2*pi*4*t);
>> plot(t,y2);
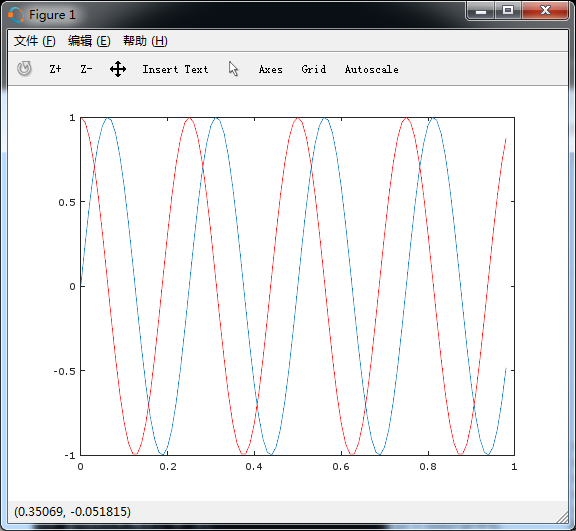
>> plot(t,y1);
>> hold on;           %覆盖
>> plot(t,y2,'r');    %y2使用红色线条
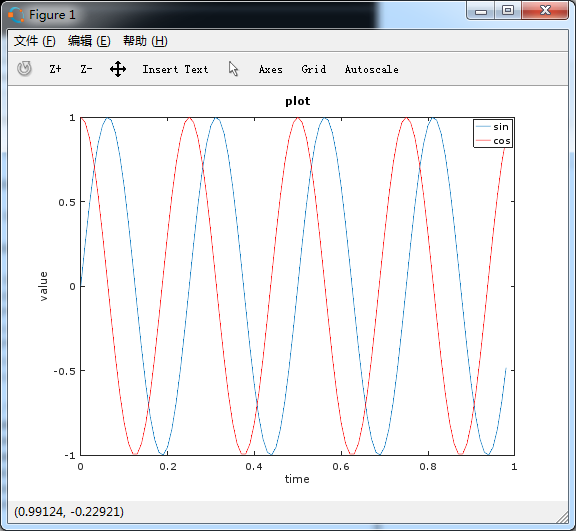
加上横纵坐标值:
>> xlabel('time')         %坐标值
>> ylabel('value')
>> legend('sin', 'cos')      %标记曲线
>> title('plot')           %标题
保存图片:
>> cd 'F:'
>> pwd
ans = F:
>> print -dpng 'myPlot.png'
关闭绘制:
>> close
同时绘制(不同窗口);
>> figure(1); plot(t,y1);
>> figure(2); plot(t,y2);
(同窗口):
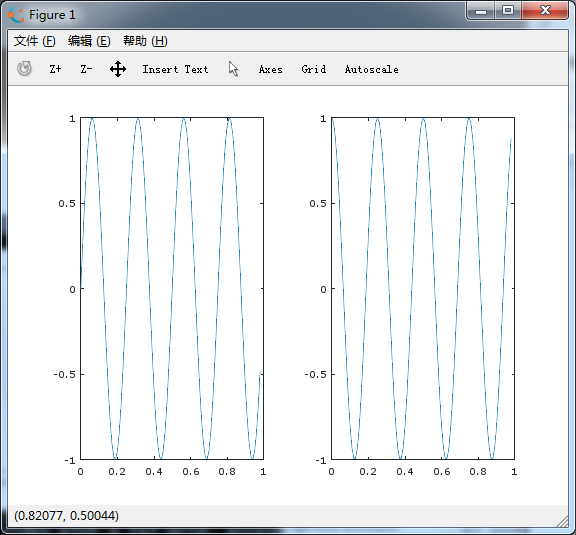
>> subplot(1,2,1);       %制造一个1*2的格子窗口,接下来在第一个窗口绘制
>> plot(t,y1);
>> subplot(1,2,2);       %在第二个窗口绘制
>> plot(t,y2);
改变刻度:
>> axis([0.5 1 -1 1]) %横坐标0.5~1,纵坐标-1~1
清除绘图:
>> clf;
绘制矩阵:
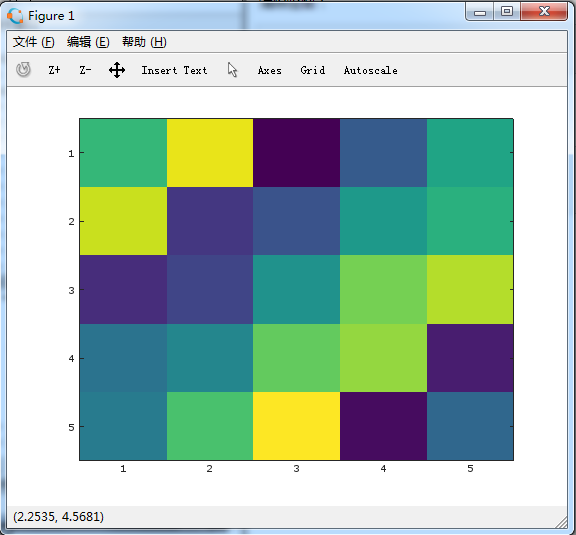
>> A = magic(5)
A =
17 24 1 8 15
23 5 7 14 16
4 6 13 20 22
10 12 19 21 3
11 18 25 2 9
>> iamgesc(A)
>> imagesc(A),colorbar, colormap gray; %同时执行三条命令
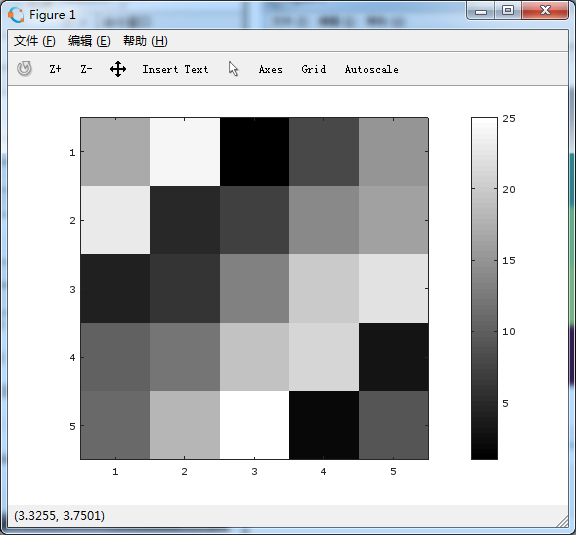
右边是颜色的值,对应矩阵图元素的值,如A(1,1)的值是17,则坐标(1,1)的颜色对应右边17的颜色值。