官网:https://www.chartjs.org/samples/latest/
入门介绍
第一步:引用JS
<script src="~/vendors/Chart.js/Chart.js"></script>
第二步:添加HTML
 <div style="75%;">
       <canvas id="myChart"></canvas>
 </div>
第三步:复制
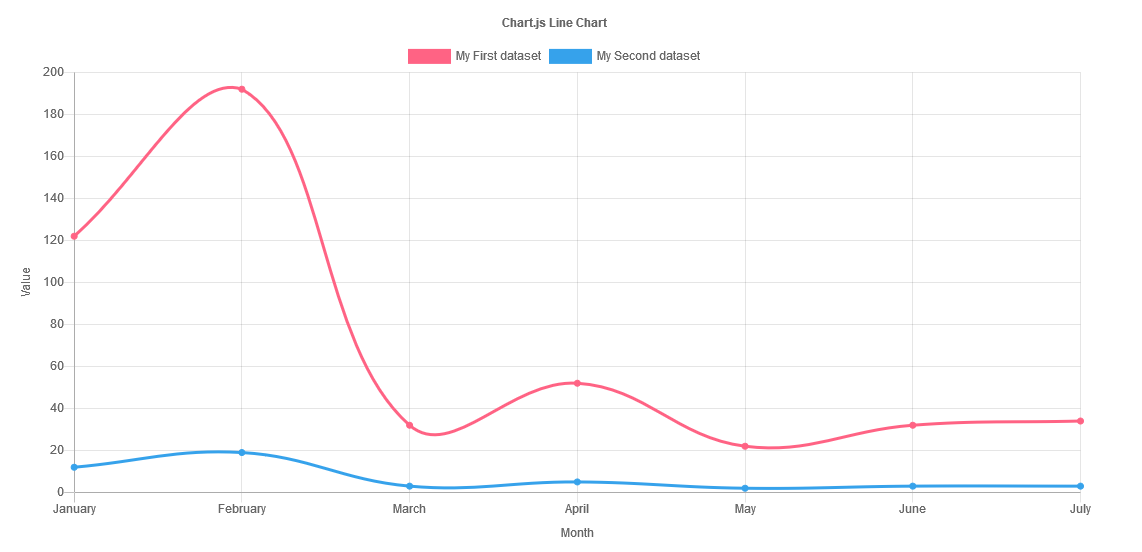
        window.chartColors = {
            red: 'rgb(255, 99, 132)',
            orange: 'rgb(255, 159, 64)',
            yellow: 'rgb(255, 205, 86)',
            green: 'rgb(75, 192, 192)',
            blue: 'rgb(54, 162, 235)',
            purple: 'rgb(153, 102, 255)',
            grey: 'rgb(201, 203, 207)'
        };

        var ctx = document.getElementById('myChart').getContext('2d');
        var chart = new Chart(ctx, {
            type: 'line',
            data: {
                labels: ['January', 'February', 'March', 'April', 'May', 'June', 'July'],
                datasets: [{
                    label: 'My First dataset',
                    backgroundColor: window.chartColors.red,
                    borderColor: window.chartColors.red,

                    data: [122, 192, 32, 52, 22, 32, 34],
                    fill: false,
                }, {
                    label: 'My Second dataset',
                    fill: false,
                    backgroundColor: window.chartColors.blue,
                    borderColor: window.chartColors.blue,
                    data: [12, 19, 3, 5, 2, 3, 3],
                }]
            },
            options: {
                responsive: true,
                title: {
                    display: true,
                    text: 'Chart.js Line Chart'
                },
                tooltips: {
                    mode: 'index',
                    intersect: false,
                },
                hover: {
                    mode: 'nearest',
                    intersect: true
                },
                scales: {
                    xAxes: [{
                        display: true,
                        scaleLabel: {
                            display: true,
                            labelString: 'Month'
                        }
                    }],
                    yAxes: [{
                        display: true,
                        scaleLabel: {
                            display: true,
                            labelString: 'Value'
                        }
                    }]
                }
            }
        });
效果如下:
其它使用
在实际使用过程中,我们是先后台请求数据,再更新图表的,因而,在图表初始化时,先给data空值,如:
           data: {
                labels: [],
                datasets: [{
                    label: 'My First dataset',
                    backgroundColor: window.chartColors.red,
                    borderColor: window.chartColors.red,

                    data: [],
                    fill: false,
                }, {
                    label: 'My Second dataset',
                    fill: false,
                    backgroundColor: window.chartColors.blue,
                    borderColor: window.chartColors.blue,
                    data: [],
                }]
            },
在Ajax数据返回时,再更新
function updateConfigByMutating(chart) {
      chart.options.title.text = 'new title';
      chart.data.labels = ['January', 'February', 'March', 'April', 'May', 'June', 'July'];
      chart.data.datasets[0].data = [200, 390, 300, 350, 320, 230, 140];
      chart.data.datasets[1].data = [50, 90, 30, 50, 20, 30, 40];
      chart.update();
}
官网有更新的相关文档:https://www.chartjs.org/docs/latest/developers/updates.html
另外,也可以整个data进行更新,如下
function updateConfigByMutating2(chart) {
      chart.options.title.text = 'new title';
      myChartData = {
                labels: ['January', 'February', 'March', 'April', 'May', 'June', 'July'],
                datasets: [{
                    label: 'My First dataset',
                    backgroundColor: window.chartColors.red,
                    borderColor: window.chartColors.red,

                    data: [122, 192, 320, 52, 22, 320, 34],
                    fill: false,
                }]
      };
      chart.data = myChartData;
      chart.update();
}