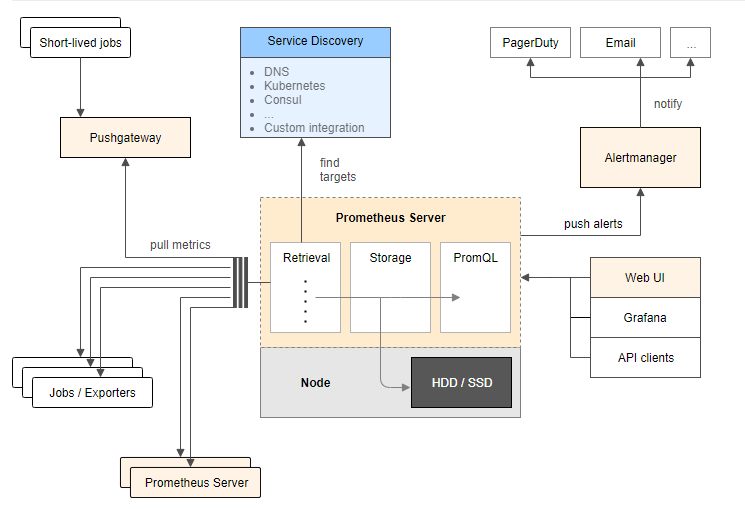
架构图
环境
| IP | 环境 | 需装软件 |
|---|---|---|
| 192.168.0.237 | mysql-5.7.20 | node_exporter-0.15.2.linux-amd64.tar.gz mysqld_exporter-0.10.0.linux-amd64.tar.gz |
| 192.168.0.248 | grafana+prometheus | prometheus-2.1.0.linux-amd64.tar.gz node_exporter-0.15.2.linux-amd64.tar.gz grafana-4.6.3.linux-x64.tar.gz |
在 192.168.0.248 上安装 grafana prometheus
安装 prometheus
# 创建保存软件的目录
mkdir /data/software/ -p

cd /data/software/

# 解压 prometheus
tar xvf prometheus-2.1.0.linux-amd64.tar.gz -C /iba/
cd /iba/
mv prometheus-2.1.0.linux-amd64 prometheus

cd prometheus/
cp prometheus.yml /tmp/prometheus.yml.20181203

# 配置 prometheus.yml
cat prometheus.yml
# my global config
global:
  scrape_interval:    15s # Set the scrape interval to every 15 seconds. Default is every 1 minute.
  evaluation_interval: 15s # Evaluate rules every 15 seconds. The default is every 1 minute.
  # scrape_timeout is set to the global default (10s).
# A scrape configuration containing exactly one endpoint to scrape:
# Here it's Prometheus itself.
scrape_configs:
- job_name: 'Host'
  file_sd_configs:
  - files:
    - host.yml
  metrics_path: /metrics
  relabel_configs:
  - source_labels: [__address__]
    regex: (.*)
    target_label: instance
    replacement: $1
  - source_labels: [__address__]
    regex: (.*)
    target_label: __address__
    replacement: $1:9100

- job_name: 'MySQL'
  file_sd_configs:
  - files:
    - mysql.yml
  metrics_path: /metrics
  relabel_configs:
  - source_labels: [__address__]
    regex: (.*)
    target_label: instance
    replacement: $1
  - source_labels: [__address__]
    regex: (.*)
    target_label: __address__
    replacement: $1:9104

- job_name: 'prometheus'
  static_configs:
  - targets:
    - localhost:9090

cat host.yml
- labels:
    service: test
  targets:
  - 192.168.0.248
  - 192.168.0.237

cat mysql.yml
- labels:
    service: test
  targets:
  - 192.168.0.237

# 测试 prometheus 是否可以正常启动
/iba/prometheus/prometheus --storage.tsdb.retention=30d &

ps -ef|grep prometh
kill -9 14650

# 配置 prometheus.service 文件
vi /usr/lib/systemd/system/prometheus.service
# 内容为
[Unit]
Description=Prometheus instance
Wants=network-online.target
After=network-online.target

[Service]
User=root
Group=root
Type=simple
Restart=on-failure
WorkingDirectory=/iba/prometheus/
RuntimeDirectory=prometheus
RuntimeDirectoryMode=0750
ExecStart=/iba/prometheus/prometheus  --storage.tsdb.retention=30d --config.file=/iba/prometheus/prometheus.yml
LimitNOFILE=10000
TimeoutStopSec=20

[Install]
WantedBy=multi-user.target

# 启动 prometheus
systemctl start prometheus

systemctl status prometheus -l

# 开放防火墙
firewall-cmd --permanent --add-rich-rule="rule family="ipv4" source address="192.168.0.0/16" accept"
firewall-cmd --reload
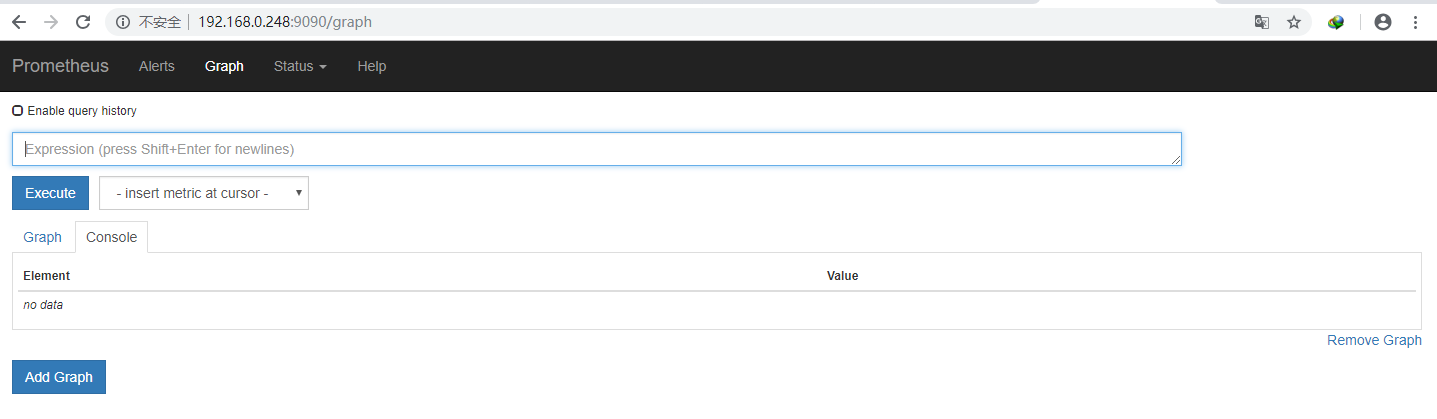
浏览器输入 http://192.168.0.248:9090 访问
prometheus.yml 文件参考:
https://prometheus.io/docs/prometheus/latest/configuration/configuration/
https://prometheus.io/docs/prometheus/latest/configuration/configuration/#<relabel_config>
https://prometheus.io/docs/prometheus/latest/configuration/configuration/#<file_sd_config>
安装 node_exporter 获取主机信息
# 解压 node_exporter
cd /data/software/
tar xf node_exporter-0.15.2.linux-amd64.tar.gz -C /usr/local
mv node_exporter-0.15.2.linux-amd64 node_exporter
nohup ./node_exporter &
安装 grafana
cd /iba/software

# 解压
tar xf grafana-4.6.3.linux-x64.tar.gz -C /iba/prometheus/
cd /iba/prometheus/
mv grafana-4.6.3 grafana
cd grafana/

# 测试
./bin/grafana-server

# 停止
ctrl+c

cat /usr/lib/systemd/system/grafana-server.service
[Unit]
Description=Grafana instance
Documentation=http://docs.grafana.org
Wants=network-online.target
After=network-online.target

[Service]
User=root
Group=root
Type=simple
Restart=on-failure
WorkingDirectory=/iba/prometheus/grafana
RuntimeDirectory=grafana
RuntimeDirectoryMode=0750
ExecStart=/iba/prometheus/grafana/bin/grafana-server
LimitNOFILE=10000
TimeoutStopSec=20

[Install]
WantedBy=multi-user.target

# 启动
systemctl start grafana-server
systemctl status grafana-server -l
访问 http://192.168.0.248:3000,默认用户和密码是 admin/admin

配置数据源


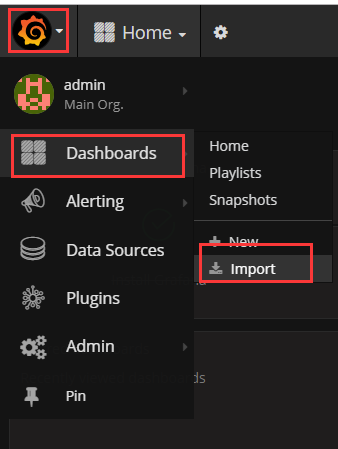
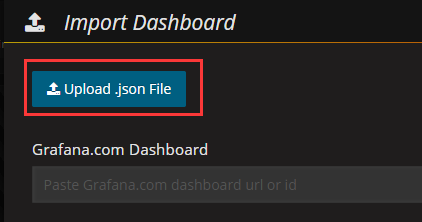
下载 grafana-dashboards-1.6.1.tar.gz,解压,使用浏览器导入 dashboard, 下载地址:https://github.com/percona/grafana-dashboards/archive/v1.6.1.tar.gz

在 192.168.0.237 安装 node_exporter 和 mysqld_exporter
cd /iba/software/
tar zxf node_exporter-0.15.2.linux-amd64.tar.gz -C /usr/local/
cd /usr/local/
mv node_exporter-0.15.2.linux-amd64 node_exporter

# 启动
cd node_exporter/
nohup ./node_exporter &
几分钟后 grafana 出现了新服务器的信息

在mysql上配置监控使用的用户
GRANT REPLICATION CLIENT, PROCESS, SELECT ON *.* TO 'mysql_monitor'@'%' IDENTIFIED BY 'mysql_monitor';
FLUSH PRIVILEGES;
cd /iba/software/
tar zxf mysqld_exporter-0.10.0.linux-amd64.tar.gz -C /usr/local/
cd /usr/local/
mv mysqld_exporter-0.10.0.linux-amd64/ mysqld_exporter
cd mysqld_exporter/

# 在 mysql 上创建一个专门用于监控的用户,
cat .my.cnf
[client]
user=mysql_monitor
password=mysql_monitor

# 启动
nohup /usr/local/mysqld_exporter/mysqld_exporter  -config.my-cnf="/usr/local/mysqld_exporter/.my.cnf" &
导入 dashboard: MySQL_Overview.json
