JVM系列笔记目录
- 虚拟机的基础概念
- class文件结构
- class文件加载过程
- jvm内存模型
- JVM常用指令
- GC与调优
主要内容
分析PS、CMS、G1的回收日志,目标使大概能读懂GC日志。
测试程序
java的版本是1.8,测试思路是用死循环中不停分配1M大小的数组 ,这样在启动时候指定较小的您内存空间,很快就会产生GC。
import java.util.LinkedList;
import java.util.List;

public class HelloGC {
    public static void main(String[] args) {
        System.out.println("HelloGC!");
        List list = new LinkedList();
        for(;;) {
            // 死循环中不停分配1M大小的数组
            byte[] b = new byte[1024*1024];
            list.add(b);
        }
    }
}
PS日志分析
-
启动命令:
java -Xmn10M -Xms40M -Xmx60M -XX:+PrintCommandLineFlags -XX:+PrintGC -XX:+Us eParallelGC -XX:+PrintGCDetails HelloGC。指定JVM醉倒内存为60M,初始内存为40M,年轻代的大小是10M,-XX:+UseParallelGC指定垃圾回收器为PS+PO,-XX:+PrintGCDetails打印出详细的GC回收日志。 -
日志
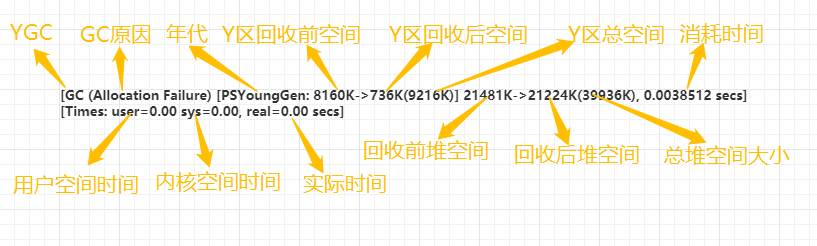
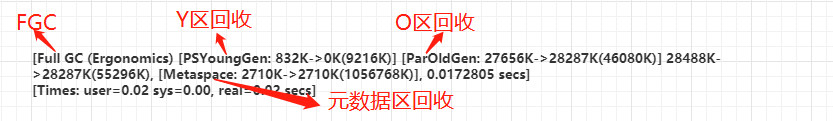
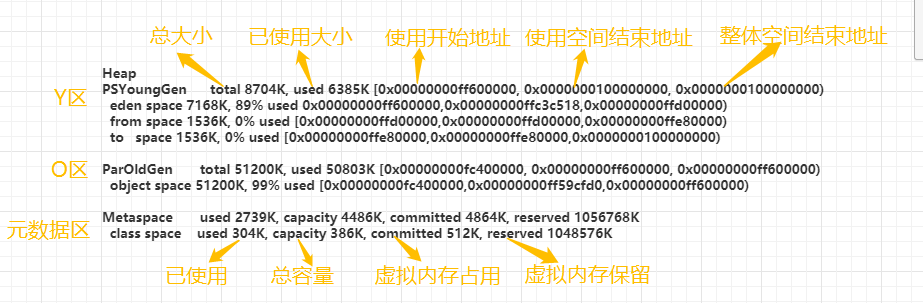
D:>java -Xmn10M -Xms40M -Xmx60M -XX:+PrintCommandLineFlags -XX:+PrintGC -XX:+UseParallelGC -XX:+PrintGCDetails HelloGC -XX:InitialHeapSize=41943040 -XX:MaxHeapSize=62914560 -XX:MaxNewSize=10485760 -XX:NewSize=10485760 -XX:+PrintCommandLineFlags -XX:+PrintGC -XX:+PrintGCDetails -XX:+UseCompresse dClassPointers -XX:+UseCompressedOops -XX:-UseLargePagesIndividualAllocation -XX:+UseParallelGC HelloGC! [GC (Allocation Failure) [PSYoungGen: 7292K->784K(9216K)] 7292K->6936K(39936K), 0.0035951 secs] [Times: user=0.00 sys=0.00, real=0.00 secs] [GC (Allocation Failure) [PSYoungGen: 8112K->840K(9216K)] 14264K->14160K(39936K), 0.0034203 secs] [Times: user=0.03 sys=0.06, real=0.00 secs] [GC (Allocation Failure) [PSYoungGen: 8160K->736K(9216K)] 21481K->21224K(39936K), 0.0038512 secs] [Times: user=0.00 sys=0.00, real=0.00 secs] [GC (Allocation Failure) [PSYoungGen: 8059K->832K(9216K)] 28547K->28488K(39936K), 0.0031367 secs] [Times: user=0.00 sys=0.00, real=0.00 secs] [Full GC (Ergonomics) [PSYoungGen: 832K->0K(9216K)] [ParOldGen: 27656K->28287K(46080K)] 28488K->28287K(55296K), [Metaspace: 2710K->2710K(1056 768K)], 0.0172805 secs] [Times: user=0.02 sys=0.00, real=0.02 secs] [GC (Allocation Failure) [PSYoungGen: 7325K->224K(8704K)] 35612K->35679K(54784K), 0.0034935 secs] [Times: user=0.00 sys=0.00, real=0.00 secs] [GC (Allocation Failure) [PSYoungGen: 7542K->1248K(8704K)] 42997K->42847K(54784K), 0.0032856 secs] [Times: user=0.00 sys=0.00, real=0.00 secs ] [Full GC (Ergonomics) [PSYoungGen: 1248K->0K(8704K)] [ParOldGen: 41599K->42623K(51200K)] 42847K->42623K(59904K), [Metaspace: 2710K->2710K(105 6768K)], 0.0056374 secs] [Times: user=0.00 sys=0.00, real=0.01 secs] [GC (Allocation Failure) [PSYoungGen: 6278K->1216K(8704K)] 48902K->48960K(59904K), 0.0034283 secs] [Times: user=0.00 sys=0.00, real=0.00 secs ] [Full GC (Ergonomics) [PSYoungGen: 1216K->0K(8704K)] [ParOldGen: 47744K->48768K(51200K)] 48960K->48768K(59904K), [Metaspace: 2710K->2710K(105 6768K)], 0.0044365 secs] [Times: user=0.00 sys=0.00, real=0.00 secs] [Full GC (Ergonomics) [PSYoungGen: 6272K->4096K(8704K)] [ParOldGen: 48768K->50816K(51200K)] 55040K->54912K(59904K), [Metaspace: 2710K->2710K( 1056768K)], 0.0060174 secs] [Times: user=0.09 sys=0.02, real=0.01 secs] [Full GC (Ergonomics) [PSYoungGen: 6268K->6144K(8704K)] [ParOldGen: 50816K->50816K(51200K)] 57084K->56960K(59904K), [Metaspace: 2710K->2710K( 1056768K)], 0.0043812 secs] [Times: user=0.00 sys=0.00, real=0.00 secs] [Full GC (Allocation Failure) [PSYoungGen: 6144K->6144K(8704K)] [ParOldGen: 50816K->50803K(51200K)] 56960K->56948K(59904K), [Metaspace: 2710K ->2710K(1056768K)], 0.0164153 secs] [Times: user=0.09 sys=0.00, real=0.02 secs] Exception in thread "main" java.lang.OutOfMemoryError: Java heap space at HelloGC.main(HelloGC.java:9) Heap PSYoungGen total 8704K, used 6385K [0x00000000ff600000, 0x0000000100000000, 0x0000000100000000) eden space 7168K, 89% used 0x00000000ff600000,0x00000000ffc3c518,0x00000000ffd00000) from space 1536K, 0% used [0x00000000ffd00000,0x00000000ffd00000,0x00000000ffe80000) to space 1536K, 0% used [0x00000000ffe80000,0x00000000ffe80000,0x0000000100000000) ParOldGen total 51200K, used 50803K [0x00000000fc400000, 0x00000000ff600000, 0x00000000ff600000) object space 51200K, 99% used [0x00000000fc400000,0x00000000ff59cfd0,0x00000000ff600000) Metaspace used 2739K, capacity 4486K, committed 4864K, reserved 1056768K class space used 304K, capacity 386K, committed 512K, reserved 1048576K- YGC分析
- FGC分析
- 堆空间分析
CMS日志
回顾一下CMS回收主要4个阶段:初始标记、并发标记、最终标记、并发回收。
补充一个Card Table的概念
由于做YGC时,需要扫描整个OLD区,效率非常低,所以JVM设计了CardTable, 如果一个OLD区CardTable中某个Card有对象指向Y区,就将它设为Dirty,下次扫描时,只需要扫描Dirty Card。在结构上,Card Table用BitMap来实现。
-
启动命令
java -Xmn20M -Xmx20M -XX:+PrintCommandLineFlags -XX:+PrintGC -XX:+PrintGCDetails -XX:+UseConcMarkSweepGC HelloGC。参数-XX:+UseConcMarkSweepGC指定使用CMS垃圾回收器。 -
日志分析
-
YGC
[GC (Allocation Failure) [ParNew: 6144K->640K(6144K), 0.0265885 secs] 6585K->2770K(19840K), 0.0268035 secs] [Times: user=0.02 sys=0.00, real=0.02 secs]
ParNew:年轻代收集器
6144->640:收集前后的对比
(6144):整个年轻代容量
6585 -> 2770:整个堆的情况
(19840):整个堆大小
-
CMS的回收
// 初始标记
//8511 (13696) : 老年代使用(最大)
//9866 (19840) : 整个堆使用(最大)
[GC (CMS Initial Mark) [1 CMS-initial-mark: 8511K(13696K)] 9866K(19840K), 0.0040321 secs] [Times: user=0.01 sys=0.00, real=0.00 secs]

//并发标记 这里的时间意义不大,因为是并发执行
[CMS-concurrent-mark-start]
[CMS-concurrent-mark: 0.018/0.018 secs] [Times: user=0.01 sys=0.00, real=0.02 secs]

// 标记Card为Dirty,也称为Card Marking
[CMS-concurrent-preclean-start]
[CMS-concurrent-preclean: 0.000/0.000 secs] [Times: user=0.00 sys=0.00, real=0.00 secs]

//最终标记 STW阶段
//YG occupancy:年轻代占用及容量
//[Rescan (parallel):STW下的存活对象标记
//weak refs processing: 弱引用处理
//class unloading: 卸载用不到的class
//scrub symbol(string) table: 官方的解释cleaning up symbol and string tables which //hold class-level metadata and internalized string respectively
//CMS-remark: 8511K(13696K): 阶段过后的老年代占用及容量
//10108K(19840K): 阶段过后的堆占用及容量
[GC (CMS Final Remark) [YG occupancy: 1597 K (6144 K)][Rescan (parallel) , 0.0008396 secs][weak refs processing, 0.0000138 secs][class unloading, 0.0005404 secs][scrub symbol table, 0.0006169 secs][scrub string table, 0.0004903 secs][1 CMS-remark: 8511K(13696K)] 10108K(19840K), 0.0039567 secs] [Times: user=0.00 sys=0.00, real=0.00 secs]

// 最终标记 标记已经完成,进行并发清理
[CMS-concurrent-sweep-start]
[CMS-concurrent-sweep: 0.005/0.005 secs] [Times: user=0.00 sys=0.00, real=0.01 secs]

//重置内部结构,为下次GC做准备
[CMS-concurrent-reset-start]
[CMS-concurrent-reset: 0.000/0.000 secs] [Times: user=0.00 sys=0.00, real=0.00 secs]
-
G1日志
回顾一下,G1是分region回收的,有YGC、MixedGC(类似CMS)、FGC。
官方提供了 Garbage First Garbage Collector Tuning, 可以参考。
-
启动命令
java -Xms20M -Xmx20M -XX:+PrintGCDetails -XX:+UseConcMarkSweepGC HelloGC,其中-XX:+UseG1GC指定使用G1。 -
日志分析
//GC暂停
// (G1 Humongous Allocation) (young) 大对象分配
// initial-mark初始标记,这里是YGC混合老年代回收MixedGC
[GC pause (G1 Humongous Allocation) (young) (initial-mark), 0.0026947 secs]

//这是一个GC线程 多线程回收的
   [Parallel Time: 2.1 ms, GC Workers: 8]
      [GC Worker Start (ms): Min: 137.2, Avg: 137.2, Max: 137.3, Diff: 0.1]
      [Ext Root Scanning (ms): Min: 0.0, Avg: 0.4, Max: 0.6, Diff: 0.6, Sum: 3.5]
      // 更新Rset
      [Update RS (ms): Min: 0.0, Avg: 0.0, Max: 0.0, Diff: 0.0, Sum: 0.0]
         [Processed Buffers: Min: 0, Avg: 0.0, Max: 0, Diff: 0, Sum: 0]
      [Scan RS (ms): Min: 0.0, Avg: 0.0, Max: 0.0, Diff: 0.0, Sum: 0.0]
      [Code Root Scanning (ms): Min: 0.0, Avg: 0.0, Max: 0.2, Diff: 0.2, Sum: 0.2]
      //拷贝存活对象
      [Object Copy (ms): Min: 1.1, Avg: 1.2, Max: 1.3, Diff: 0.2, Sum: 9.7]
      [Termination (ms): Min: 0.0, Avg: 0.1, Max: 0.1, Diff: 0.1, Sum: 0.5]
         [Termination Attempts: Min: 1, Avg: 1.0, Max: 1, Diff: 0, Sum: 8]
      [GC Worker Other (ms): Min: 0.1, Avg: 0.3, Max: 0.7, Diff: 0.6, Sum: 2.1]
      [GC Worker Total (ms): Min: 2.0, Avg: 2.0, Max: 2.0, Diff: 0.1, Sum: 16.0]
      [GC Worker End (ms): Min: 139.2, Avg: 139.3, Max: 139.3, Diff: 0.0]
   [Code Root Fixup: 0.0 ms]
   [Code Root Purge: 0.0 ms]
   [Clear CT: 0.1 ms]
   [Other: 0.5 ms]
      [Choose CSet: 0.0 ms]
      [Ref Proc: 0.1 ms]
      [Ref Enq: 0.0 ms]
      [Redirty Cards: 0.1 ms]
      [Humongous Register: 0.0 ms]
      [Humongous Reclaim: 0.0 ms]
      [Free CSet: 0.0 ms]
   [Eden: 2048.0K(12.0M)->0.0B(4096.0K) Survivors: 0.0B->1024.0K Heap: 5122.1K(20.0M)->4880.1K(20.0M)]
 [Times: user=0.00 sys=0.00, real=0.01 secs]
 // 以下是MixedGC的其它阶段 类似CMS
[GC concurrent-root-region-scan-start]
[GC concurrent-root-region-scan-end, 0.0008043 secs]
[GC concurrent-mark-start]
[GC concurrent-mark-end, 0.0001578 secs]
[GC remark [Finalize Marking, 0.0001140 secs] [GC ref-proc, 0.0001270 secs]

// 卸载
[Unloading, 0.0011719 secs], 0.0017205 secs]
 [Times: user=0.00 sys=0.00, real=0.00 secs]
 // 清理
[GC cleanup 8034K->8034K(20M), 0.0004763 secs]
 [Times: user=0.00 sys=0.00, real=0.00 secs]

//其它的GC线程类似
......

//无法分配进行FGC
[Full GC (Allocation Failure)  9855K->9842K(20M), 0.0029134 secs]
   [Eden: 0.0B(1024.0K)->0.0B(1024.0K) Survivors: 0.0B->0.0B Heap: 9855.3K(20.0M)->9843.0K(20.0M)], [Metaspace: 2710K->2710K(1056768K)]
 [Times: user=0.00 sys=0.00, real=0.00 secs]
[GC concurrent-mark-abort]
Exception in thread "main" java.lang.OutOfMemoryError: Java heap space
        at HelloGC.main(HelloGC.java:9)

// 堆空间的情况
Heap
 garbage-first heap   total 20480K, used 9842K [0x00000000fec00000, 0x00000000fed000a0, 0x0000000100000000)
  region size 1024K, 1 young (1024K), 0 survivors (0K)
 Metaspace       used 2739K, capacity 4486K, committed 4864K, reserved 1056768K
  class space    used 304K, capacity 386K, committed 512K, reserved 1048576K
总结
本篇对PS、CMS、G1的日志进行了较为详细的分析,基本可以参照着看懂垃圾回收的的过程。
知识分享,转载请注明出处。学无先后,达者为先!