代码:
n = [0:1:99]; x = cos(0.48*pi*n) + cos(0.52*pi*n);
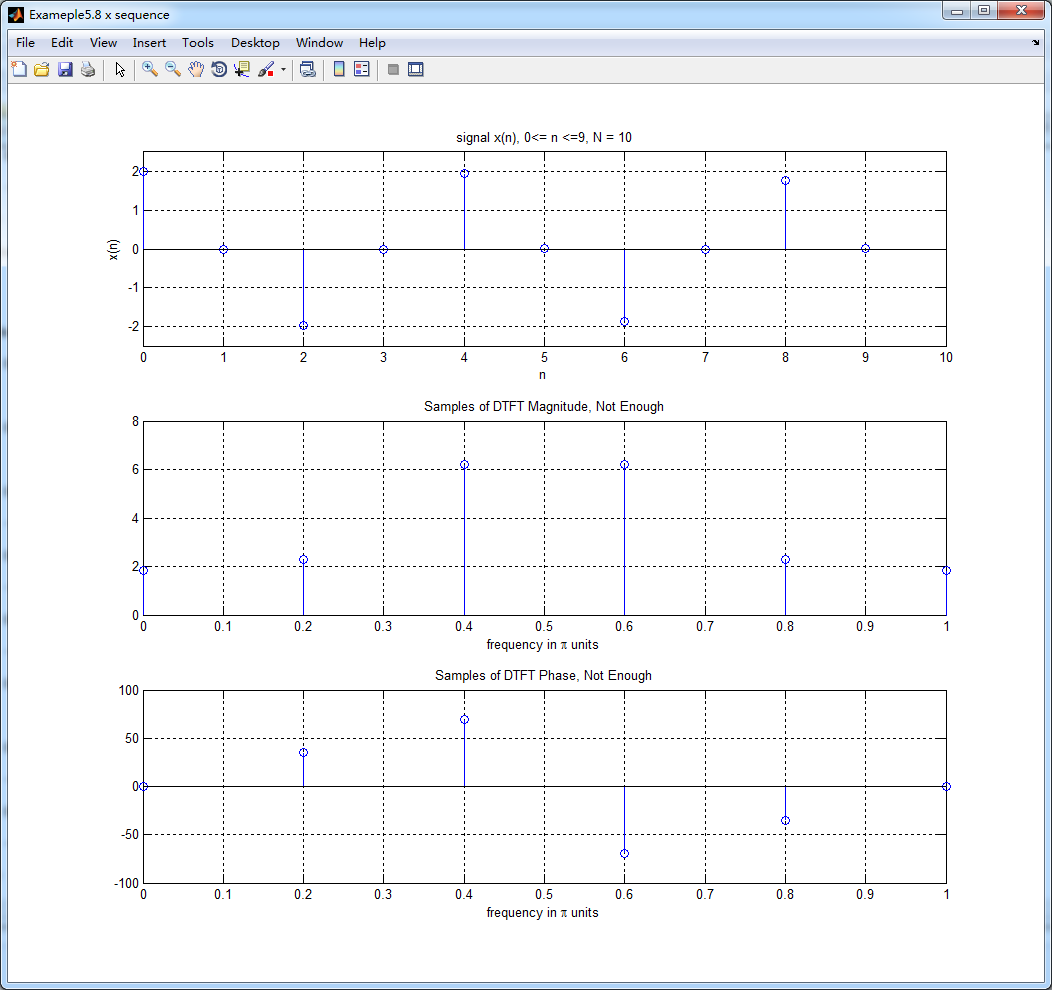
n1 = [0:1:9]; y1 = x(1:1:10); % N = 10
figure('NumberTitle', 'off', 'Name', 'Exameple5.8 x sequence')
set(gcf,'Color','white');
subplot(3,1,1); stem(n1,y1); title('signal x(n), 0<= n <=9, N = 10'); axis([0,10,-2.5,2.5]);
xlabel('n'); ylabel('x(n)'); grid on;
Y1_DFT = dft(y1,10); % DFT of y1
magY1_DFT = abs(Y1_DFT(1:1:6));
%magY1_DFT = abs(Y1_DFT);
%phaY1_DFT = angle(Y1_DFT)*180/pi % degrees
phaY1_DFT = angle(Y1_DFT(1:1:6))*180/pi % degrees
%realX_DFT = real(X_DFT); imagX_DFT = imag(X_DFT);
%angX_DFT = angle(X_DFT); % radias
k1 = 0:1:5; w1 = 2*pi/10*k1; % [0,2pi] axis divided into 501 points.
%k = 0:500; w = (pi/500)*k; % [0,pi] axis divided into 501 points.
%X_DTFT = x * (exp(-j*pi/500)) .^ (n'*k); % DTFT of x(n)
%magX_DTFT = abs(X_DTFT); angX_DTFT = angle(X_DTFT); realX_DTFT = real(X_DTFT); imagX_DTFT = imag(X_DTFT);
subplot(3,1,2); stem(w1/pi,magY1_DFT); title('Samples of DTFT Magnitude, Not Enough'); %axis([0,N,-0.5,1.5]);
xlabel('frequency in pi units');
%ylabel('x(n)');
grid on;
subplot(3,1,3); stem(w1/pi,phaY1_DFT); title('Samples of DTFT Phase, Not Enough'); %axis([0,N,-0.5,1.5]);
xlabel('frequency in pi units');
%ylabel('x(n)');
grid on;
%% ------------------------------------------------------
%% zero-padding coperation, Append 90 zeros
%% To obtain a dense spectrum
%% ------------------------------------------------------
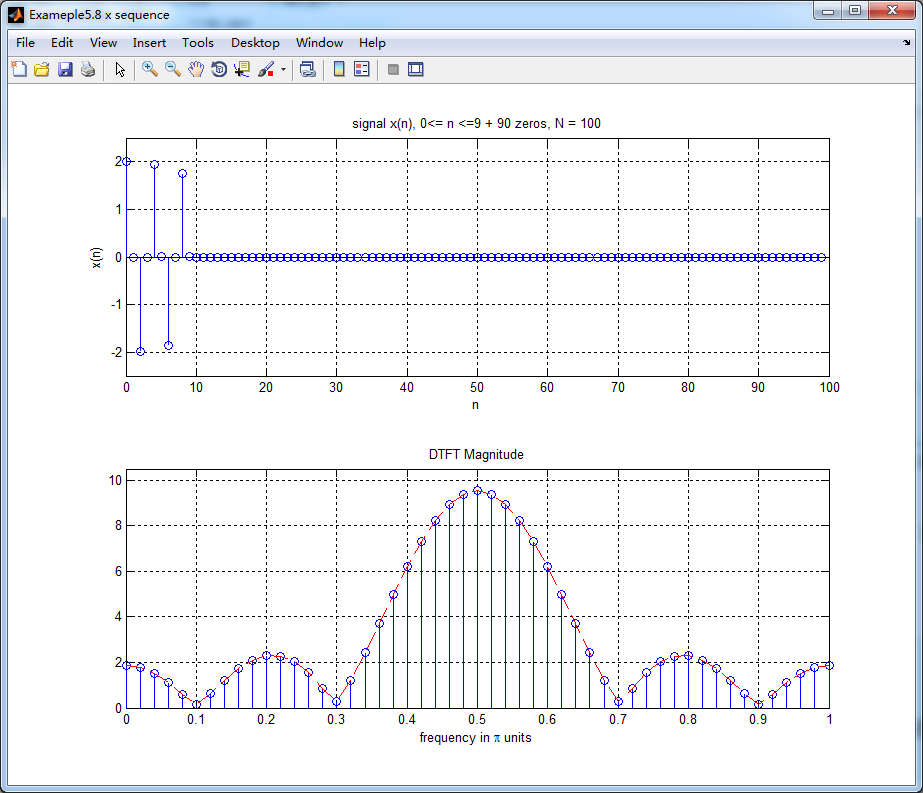
n2 = [0:1:99]; y2 = [x(1:1:10) zeros(1,90)]; % zero-padding, N = 100
figure('NumberTitle', 'off', 'Name', 'Exameple5.8 x sequence')
set(gcf,'Color','white');
subplot(2,1,1); stem(n2,y2); title('signal x(n), 0<= n <=9 + 90 zeros, N = 100'); axis([0,100,-2.5,2.5]);
xlabel('n'); ylabel('x(n)'); grid on;
Y2_DFT = dft(y2,100); % DFT of y2
magY2_DFT = abs(Y2_DFT(1:1:51));
phaY2_DFT = angle(Y2_DFT)*180/pi % degrees
k2 = 0:1:50; w2 = (2*pi/100)*k2; % [0,2pi] axis divided into 501 points.
subplot(2,1,2); stem(w2/pi,magY2_DFT); hold on; plot(w2/pi,magY2_DFT,'--r');
title('DTFT Magnitude'); axis([0,1,0,10.5]); hold off;
xlabel('frequency in pi units');
%ylabel('x(n)');
grid on;
%% -----------------------------------------------------------
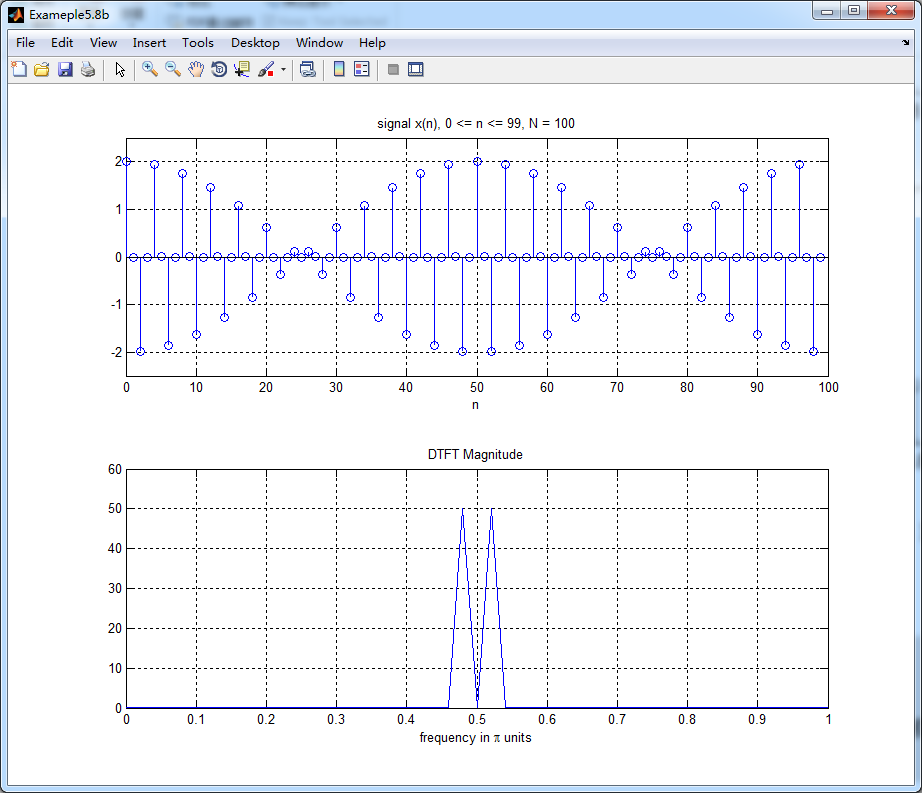
%% Exameple5.8b take first 100 samples of x(n)
%% determine the DTFT
%% -----------------------------------------------------------
figure('NumberTitle', 'off', 'Name', 'Exameple5.8b ')
set(gcf,'Color','white');
subplot(2,1,1); stem(n,x); axis([0,100,-2.5,2.5]);
title('signal x(n), 0 <= n <= 99, N = 100'); xlabel('n'); grid on;
X = dft(x,100); magX = abs(X(1:1:51));
k = 0:1:50; w = 2*pi/100*k;
subplot(2,1,2); plot(w/pi, magX); title('DTFT Magnitude');
xlabel('frequency in pi units'); axis([0,1,0,60]); grid on;
%% -----------------------------------------------------------
%% END Exameple5.8b
%% -----------------------------------------------------------
结果: