代码:
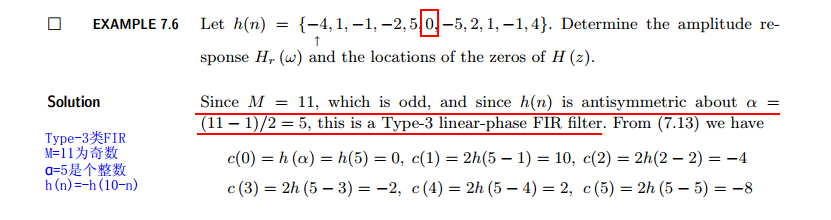
h = [-4, 1, -1, -2, 5, 0, -5, 2, 1, -1, 4];
M = length(h); n = 0:M-1;
[Hr, w, c, L] = Hr_Type3(h);
c
L

cmax = max(c) + 1; cmin = min(c) - 1;

figure('NumberTitle', 'off', 'Name', 'Exameple 7.6')
set(gcf,'Color','white');

subplot(2,2,1); stem(n, h); axis([-1, 2*L+1, cmin, cmax]); grid on;
xlabel('n'); ylabel('h(n)'); title('Impulse Response');

subplot(2,2,3); stem(0:L, c); axis([-1, 2*L+1, cmin, cmax]); grid on;
xlabel('n'); ylabel('c(n)'); title('c(n) coefficients');

subplot(2,2,2); plot(w/pi, Hr); grid on;
xlabel('frequency in pi units'); ylabel('Hr'); title('Type-3 Amplitude Response');

subplot(2,2,4); zplane(h); grid on;
xlabel('real axis'); ylabel('imaginary axis'); title('Pole-Zero Plot');
运行结果:

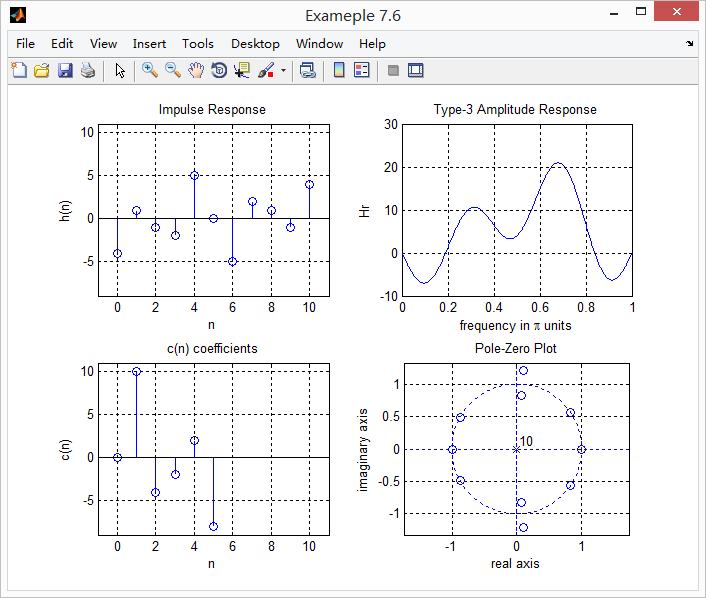
从右上角图中看出,ω=0、π的时候,振幅为零。两个零点对。