这篇文章主要介绍了Linux系统IO分析工具之iotop参数详解(查看IO占用),本文着重注解了iotop工具的参数,以及可操作命令,需要的朋友可以参考下
简介:
iotop – simple top-like I/O monitor
iotop是一个用来监视磁盘I/O使用状况的 top 类工具,可监测到哪一个程序使用的磁盘IO的信息(requires 2.6.20 or later)
安装:
yum -y install iotop
用法:
iotop [OPTIONS]
选项:
--version #显示版本号
-h, --help #显示帮助信息
-o, --only #显示进程或者线程实际上正在做的I/O,而不是全部的,可以随时切换按o
-b, --batch #运行在非交互式的模式
-n NUM, --iter=NUM #在非交互式模式下,设置显示的次数,
-d SEC, --delay=SEC #设置显示的间隔秒数,支持非整数值
-p PID, --pid=PID #只显示指定PID的信息
-u USER, --user=USER #显示指定的用户的进程的信息
-P, --processes #只显示进程,一般为显示所有的线程
-a, --accumulated #显示从iotop启动后每个线程完成了的IO总数
-k, --kilobytes #以千字节显示
-t, --time #在每一行前添加一个当前的时间
-q, --quiet #suppress some lines of header (implies --batch). This option can be specified up to three times to remove header lines.
-q column names are only printed on the first iteration,
-qq column names are never printed,
-qqq the I/O summary is never printed.
可用的命令(在运行iotop命令后按相应键位):
使用left和right改变排序(方向键改变排序列),还可使用以下命令:
r:反向排序,
o:切换至选项--only,
p:切换至--processes选项,
a:切换至--accumulated选项
q:退出
i:改变线程的优先级
例子:
$ iotop
$ iotop –b –n 3 –d 5


介绍
Linux下的IO统计工具如iostat, nmon等大多数是只能统计到per设备的读写情况, 如果你想知道每个进程是如何使用IO的就比较麻烦.
iotop 是一个用来监视磁盘 I/O 使用状况的 top 类工具。iotop 具有与 top 相似的 UI,其中包括 PID、用户、I/O、进程等相关信息。
实例
直接运行就好
iotop
输出如下
Total DISK READ:       6.01 M/s | Total DISK WRITE:       3.85 K/s
  TID  PRIO  USER     DISK READ  DISK WRITE  SWAPIN     IO>    COMMAND
20074 be/4 hadoop      6.01 M/s    0.00 B/s  0.00 %  4.54 % java -Dproc_datanode -Xmx8192m -server  org.apache.hadoop.hdfs.server.datanode.DataNode
 6371 be/4 hadoop      0.00 B/s    3.25 M/s  0.00 %  0.00 % java -Dproc_datanode -Xmx8192m -server  org.apache.hadoop.hdfs.server.datanode.DataNode
 8497 be/4 hadoop      0.00 B/s    3.67 M/s  0.00 %  0.00 % java -Dproc_datanode -Xmx8192m -server  org.apache.hadoop.hdfs.server.datanode.DataNode
    1 be/4 root        0.00 B/s    0.00 B/s  0.00 %  0.00 % init
    2 be/4 root        0.00 B/s    0.00 B/s  0.00 %  0.00 % [kthreadd]
通过输出结果,我们可以清楚地知晓是什么程序在读写磁盘,速度以及命令行,pid 等信息。
在使用LINUX时经常会遇到系统IO占用很高,系统IO占用可以使用iostat -x 1查看
但很多时候知道磁盘IO负载高,但并不知道是什么程序占用的,是PHP,还是MYSQL,还是其它的,这就不好查看了。iotop工具可以实现
以ubuntu为例:
安装
root@ubuntu111064:~# apt-get install iotop
安装完成后
执行iotop
就可以看到类似top一样的显示
iotop 详细参数:
root@ubuntu111064:~# iotop -h
unable to set locale, falling back to the default locale
Usage: /usr/bin/iotop [OPTIONS]
DISK READ and DISK WRITE are the block I/O bandwidth used during the sampling
period. SWAPIN and IO are the percentages of time the thread spent respectively
while swapping in and waiting on I/O more generally. PRIO is the I/O priority at
which the thread is running (set using the ionice command).
Controls: left and right arrows to change the sorting column, r to invert the
sorting order, o to toggle the –only option, p to toggle the –processes
option, a to toggle the –accumulated option, q to quit, any other key to force
a refresh.
Options:
–version show program’s version number and exit
-h, –help show this help message and exit
-o, –only only show processes or threads actually doing I/O
-b, –batch non-interactive mode
-n NUM, –iter=NUM number of iterations before ending [infinite]
-d SEC, –delay=SEC delay between iterations [1 second]
-p PID, –pid=PID processes/threads to monitor [all]
-u USER, –user=USER users to monitor [all]
-P, –processes only show processes, not all threads
-a, –accumulated show accumulated I/O instead of bandwidth
-k, –kilobytes use kilobytes instead of a human friendly unit
-t, –time add a timestamp on each line (implies –batch)
-q, –quiet suppress some lines of header (implies –batch)
-p 指定进程ID,显示该进程的IO情况
-u 指定用户名,显示该用户所有的进程IO情况
linux系统中,管理员可以使用top来监控进程的cpu和内存的使用情况,但是对于磁盘的i/o则只能使用iostat笼统地进行监视,不能对应进程这对于管理员来说很不方便。比如你的服务器负载很低,内存使用也很少,但是硬盘狂转,但你就是无法准确确定是哪个进程在搞鬼。最近在google这个问题时,偶然发现了io监控这缺失的一环的工具。这就是iotop ,当前的最新版本是0.2.1,官方网站提供了源码和rpm包下载。
官方网站: http://guichaz.free.fr/iotop/
iotop 需要python版本>=2.5,且系统内核>=2.6.20
iotop可以显示磁盘读写的速率,交换分区进出情况和整体磁盘性能状况,这些都是按照每个进程使用情况来统计。进程列表按照I/O使用状态排序并每秒刷新一次。
IO负载高的来源定位
前言:
在一般运维工作中经常会遇到这么一个场景,服务器的IO负载很高(iostat中的util),但是无法快速的定位到IO负载的来源进程和来源文件导致无法进行相应的策略来解决问题。
这个现象在MySQL上更为常见,在5.6(performance_schema提供io instrument)之前,我们通常只能猜到是MySQL导致的高IO,但是没法定位具体是哪个文件带来的负载。
例如是ibdata的刷写?还是冷门ibd的随机读取?
本文就将介绍一个比较简单的定位IO高负载的流程。
工具准备:
iotop: http://guichaz.free.fr/iotop/
pt-ioprofile:http://www.percona.com/downloads/percona-toolkit/2.2.1/
Step1 : iostat 查看IO情况
iostat -x 1 查看IO情况,从下图可以看到dfa这个磁盘的IO负载较高,接下来我们就来定位具体的负载来源
Step2: iotop定位负载来源进程
iotop的本质是一个python脚本,从proc中获取thread的IO信息,进行汇总。
从下图可以看出大部分的IO来源都来自于mysqld进程。因此可以确定dfa的负载来源是数据库
Step3 pt-ioprofile定位负载来源文件
pt-ioprofile的原理是对某个pid附加一个strace进程进行IO分析。
以下是摘自官网的一段警示:
However, it works by attaching strace to the process using ptrace(), which will make it run very slowly until strace detaches. In addition to freezing the server, there is also some risk of the process crashing or performing badly after strace detaches from it, or indeed of strace not detaching cleanly and leaving the process in a sleeping state. As a result, this should be considered an intrusive tool, and should not be used on production servers unless you are comfortable with that.
通过ps aux|grep mysqld 找到 mysqld进程对应的进程号,通过pt-ioprofile查看哪个文件的IO占用时间最多。
默认参数下该工具展示的是IO占用的时间。
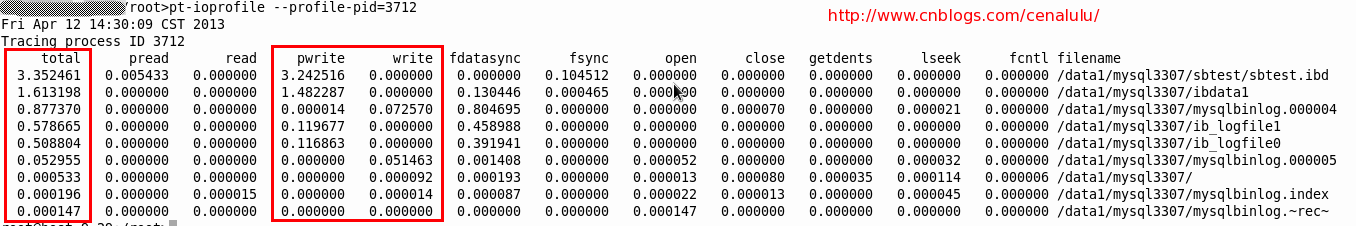
对于定位问题更有用的是通过IO的吞吐量来进行定位。使用参数 --cell=sizes,该参数将结果已 B/s 的方式展示出来
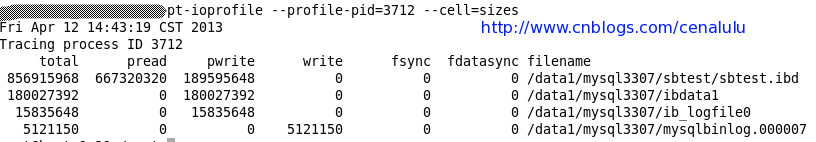
从上图可以看出IO负载的主要来源是sbtest (sysbench的IO bound OLTP测试)。
并且压力主要集中在读取上。
iotop命令是专门显示硬盘IO的命令,界面风格类似top命令。这个命令只有在kernelv2.6.20及以后的版本中才有。python版本需要 python2.7及以上版本
官方的说明:
Linux has always been able to show how much I/O was going on (the bi and bo columns of the vmstat 1 command).
Iotop is a Python program with a top like UI used to show of behalf of which process is the I/O going on. It requires Python ≥ 2.7 and a Linux kernel ≥ 2.6.20 with the TASK_DELAY_ACCT CONFIG_TASKSTATS, TASK_IO_ACCOUNTING and CONFIG_VM_EVENT_COUNTERS options on.
iotop安装:
直接yum安装。
yum install iotop
在Ubuntu里安装命令是: sudo apt-get install iotop
安装好之后在终端输入:iotop就可以了
或者:
git clone git://repo.or.cz/iotop.git
iotop使用说明:
可以用左右箭头操作,按 r 是相反方向,按 o 是动态切换
用法 iotop -参数
–version 查看版本信息的
-h, –help 查看帮助信息的
-o, –only 只显示在划硬盘的程序
-b, –batch 批量处理 用来记录日志的
-n NUM 设定循环几次
-d SEC, –delay=SEC 设定显示时间间隔