Arithmetic Mean(算数均值)
均值关注整体的一个平均水平。
https://www.investopedia.com/terms/a/arithmeticmean.asp
What Is the Arithmetic Mean?
The arithmetic mean is the simplest and most widely used measure of a mean, or average. It simply involves taking the sum of a group of numbers, then dividing that sum by the count of the numbers used in the series.
For example, take 34, 44, 56 and 78. The sum is 212. The arithmetic mean is 212 divided by four, or 53.
Variance(方差)
方差关注数据距离均值的离散程度。
https://www.investopedia.com/terms/v/variance.asp
The term variance refers to a statistical measurement of the spread between numbers in a data set. More specifically, variance measures how far each number in the set is from the mean and thus from every other number in the set. Variance is often depicted by this symbol: σ2. It is used by both analysts and traders to determine volatility and market security. The square root of the variance is the standard deviation (σ), which helps determine the consistency of an investment's returns over a period of time.
https://baike.baidu.com/item/%E6%96%B9%E5%B7%AE
方差是在概率论和统计方差衡量随机变量或一组数据时离散程度的度量。概率论中方差用来度量随机变量和其数学期望(即均值)之间的偏离程度。统计中的方差(样本方差)是每个样本值与全体样本值的平均数之差的平方值的平均数。在许多实际问题中,研究方差即偏离程度有着重要意义。
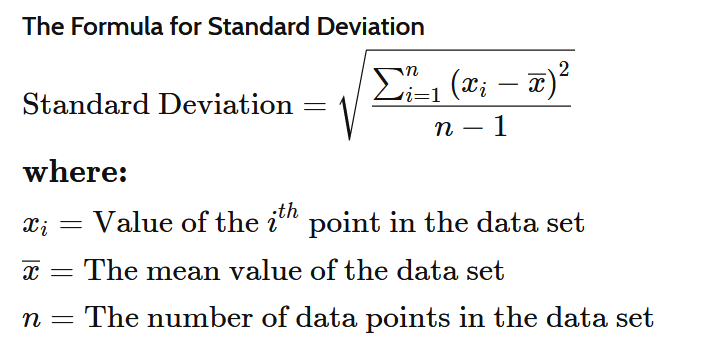
Standard Deviation Definition(标准差)
标准差是方差的平方根,跟方差一个含义。
但是量值上于 数据点数值 保持一致。方差是数据点数据的平方。
What Is Standard Deviation?
The standard deviation is a statistic that measures the dispersion of a dataset relative to its mean and is calculated as the square root of the variance. The standard deviation is calculated as the square root of variance by determining each data point's deviation relative to the mean. If the data points are further from the mean, there is a higher deviation within the data set; thus, the more spread out the data, the higher the standard deviation.
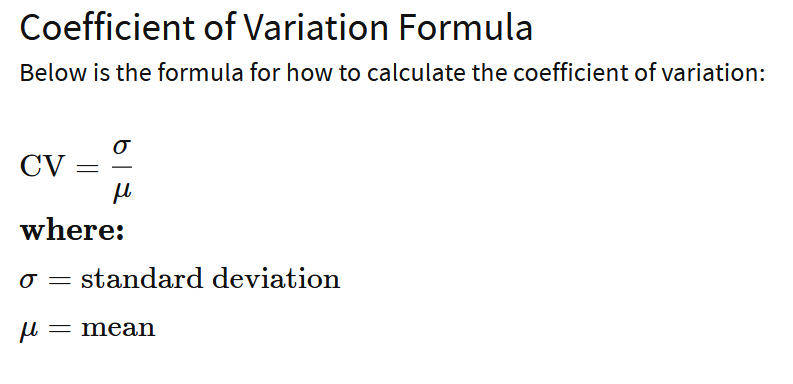
Coefficient of Variation (CV) (变异系数)
比较两组不同量值得离散度, 使用此方法。 例如一个是 cm 一个是m。
https://www.investopedia.com/terms/c/coefficientofvariation.asp
What Is the Coefficient of Variation (CV)?
The coefficient of variation (CV) is a statistical measure of the dispersion of data points in a data series around the mean. The coefficient of variation represents the ratio of the standard deviation to the mean, and it is a useful statistic for comparing the degree of variation from one data series to another, even if the means are drastically different from one another.
https://baike.baidu.com/item/%E5%8F%98%E5%BC%82%E7%B3%BB%E6%95%B0/6463621
变异系数(Coefficient of Variation):当需要比较两组数据离散程度大小的时候,如果两组数据的测量尺度相差太大,或者数据量纲的不同,直接使用标准差来进行比较不合适,此时就应当消除测量尺度和量纲的影响,而变异系数可以做到这一点,它是原始数据标准差与原始数据平均数的比。CV没有量纲,这样就可以进行客观比较了。事实上,可以认为变异系数和极差、标准差和方差一样,都是反映数据离散程度的绝对值。其数据大小不仅受变量值离散程度的影响,而且还受变量值平均水平大小的影响。
Covariance (协方差)
计算两个变量的相关程度。越大越相关。
https://www.investopedia.com/terms/c/covariance.asp
What Is Covariance?
Covariance measures the directional relationship between the returns on two assets. A positive covariance means that asset returns move together while a negative covariance means they move inversely. Covariance is calculated by analyzing at-return surprises (standard deviations from the expected return) or by multiplying the correlation between the two variables by the standard deviation of each variable.
When an analyst has a set of data, a pair of x and y values, covariance can be calculated using five variables from that data. They are:
- xi = a given x value in the data set
- xm = the mean, or average, of the x values
- yi = the y value in the data set that corresponds with xi
- ym = the mean, or average, of the y values
- n = the number of data points
Given this information, the formula for covariance is: Cov(x,y) = SUM [(xi - xm) * (yi - ym)] / (n - 1)
Correlation (相关性)
如果两个变量量值不同, 使用相关性来比较更合理。例如一个是cm,一个是m。
不同变量之间的相关度,可以在同一数量范围内比较。[-1, 1]
https://www.investopedia.com/terms/c/correlation.asp
What Is Correlation?
Correlation, in the finance and investment industries, is a statistic that measures the degree to which two securities move in relation to each other. Correlations are used in advanced portfolio management, computed as the correlation coefficient, which has a value that must fall between -1.0 and +1.0.


