reference:https://jingyan.baidu.com/article/870c6fc36fdacfb03ee4be58.html
shp: http://muchong.com/html/201304/5748467.html
MATLAB是著名的科学软件,具有绘图、编程、仿真等强大的功能。现在介绍MATLAB绘制中国地图的三种方式,分别是(1)使用m_map工具箱命令绘制中国地图;(2)使用mapshow和geoshow命令直接绘制中国地图;(3)使用worldmap+geoshow命令绘制中国地图。
由于没有找到合适的shp数据包,P/L用同一个shp;老旧的shp中缺少南海部分;
%E:wmlmatlab_workspacemapchain_sharp.shp
close all, clear all, clc, dbstop if error
infoL=shapeinfo('E:matlab_workspacemapchain_sharp.shp')
infoP=shapeinfo('E:matlab_workspacemapchain_sharp.shp')
ChinaL=shaperead('E:matlab_workspacemapchain_sharp.shp');
ChinaP=shaperead('E:matlab_workspacemapchain_sharp.shp');
bou2_4lx=[ChinaL(:).X];
bou2_4ly=[ChinaL(:).Y];
bou2_4px=[ChinaP(:).X];
bou2_4py=[ChinaP(:).Y];
figure(1)
subplot(1,2,1);
m_proj('lambert','lon',[70,140],'lat',[0,60]);m_plot(bou2_4lx,bou2_4ly,'k');
m_grid;
subplot(1,2,2);
m_proj('robinson','lon',[70,140],'lat',[0,60]);m_plot(bou2_4px,bou2_4py,'k');
m_grid;
m_coast('color','r','linewidth',1);
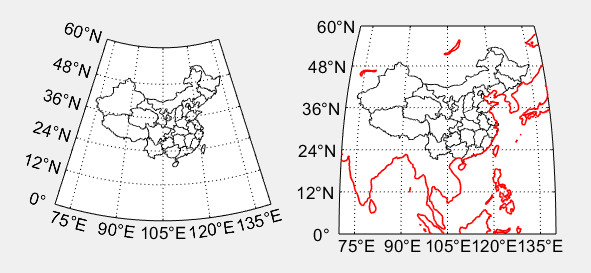
左图使用的兰伯特(lambert)投影,右图使用的罗宾逊(robinson)投影和增加了海岸线(coast)。
fnshp_L='E:matlab_workspacemapchain_sharp.shp';
fnshp_P='E:matlab_workspacemapchain_sharp.shp';
infoL=shapeinfo(fnshp_L);
infoP=shapeinfo(fnshp_P);
readL=shaperead(fnshp_L);
readP=shaperead(fnshp_P);

subplot(2,2,1);mapshow(readL,...
                      'DefaultFaceColor', 'green', ...
                      'DefaultEdgeColor', 'black');
title('China mapshow PolyLine_1')
subplot(2,2,2);mapshow(readP,...
                      'DefaultFaceColor', 'green', ...
                      'DefaultEdgeColor', 'black');
title('China mapshow Polygon_2')
subplot(2,2,3);geoshow(readL,  ...
                      'DefaultFaceColor', 'red', ...
                      'DefaultEdgeColor', 'black');
title('China geoshow PolyLine-3')
subplot(2,2,4);geoshow(readP,  ...
                      'DefaultFaceColor', 'red', ...
                      'DefaultEdgeColor', 'black');
title('China geoshow Polygon-4')
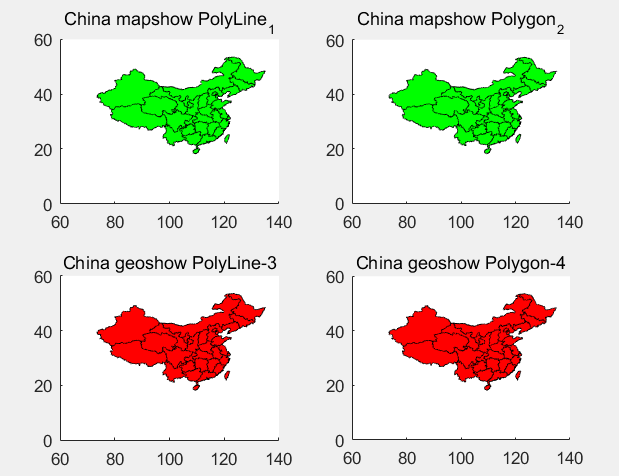
直接使用MATLAB本身自带的mapshow和geoshow命令绘制中国地图。这两个命令可以直接读取.shp格式的中国国界省界数据。
其中图1和图2使用的mapshow命令画得,并且图1使用的.shp数据为PloyLine属性的,图2使用的.shp数据为Ploygon属性的;图3和图4使用的geoshow命令画得,并且图3使用的.shp数据为PloyLine属性的,图4使用的.shp数据为Ploygon属性的。值得注意的是,title(‘ ’)命令中的下划线可以起到下角标的作用,而中划线就无此作用(对比Figure 2的前两幅图和后两幅图的标题就会发现)。
fnshp_L='E:matlab_workspacemapchain_sharp.shp';
fnshp_P='E:matlab_workspacemapchain_sharp.shp';
% infoL=shapeinfo(fnshp_L);
% infoP=shapeinfo(fnshp_P);
% readL=shaperead('E:matlab_workspacemapchain_sharp.shp');
% readP=shaperead('E:matlab_workspacemapchain_sharp.shp');
%figure(3)
subplot(2,2,1);
worldmap('China');
mapshow(fnshp_L,...
                      'DefaultFaceColor', 'green', ...
                      'DefaultEdgeColor', 'black');

subplot(2,2,2);
worldmap([0,55],[70,140]);
mapshow(fnshp_P,'FaceColor',[0.5,1.0,0.5]);
setm(gca,'MLineLocation',10);
setm(gca,'PLineLocation',10);
setm(gca,'MLabelLocation',20);
setm(gca,'PLabelLocation',10);

subplot(2,2,3);
worldmap('China');
geoshow(fnshp_L,  ...
        'DefaultFaceColor', 'white', ...
        'DefaultEdgeColor', 'black');

subplot(2,2,4);
worldmap([0,55],[70,140]);
geoshow(fnshp_P,'FaceColor',[0.5,1.0,0.5]);
setm(gca,'MLineLocation',10);
setm(gca,'PLineLocation',10);
setm(gca,'MLabelLocation',20);
setm(gca,'PLabelLocation',10);
title('中国地图','FontSize',14,'FontWeight','Bold')
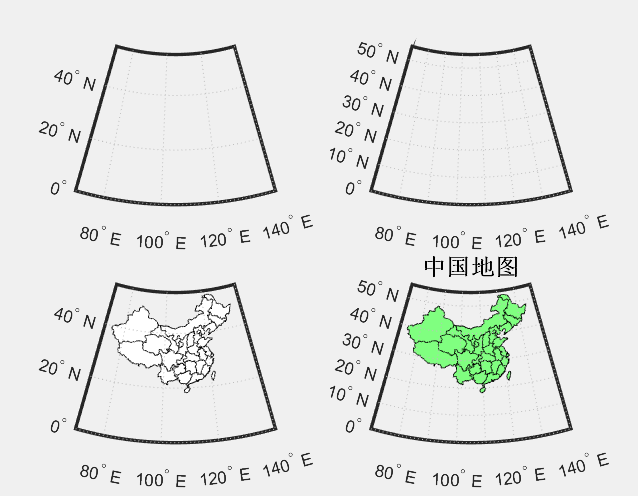
其中worldmap([0,55],[70,140])为设置显示纬度经度范围;setm(gca,'MLineLocation',10)为设置经度间隔;setm(gca,'PLineLocation',10)为设置纬度间隔;setm(gca,'MLabelLocation',20)为设置经度标签每隔几度;setm(gca,'PLabelLocation',10)为设置纬度标签每隔几度。
可以看出worldmap+mapshow命令不起作用(前两张图不显示);然后worldmap+geoshow命令起作用(后两张图效果不错)。