很长时间也没接触报表了。之前很久用过金质打印通和水晶报表
最近在看 Dev的报表 发现讲Dev这套控件XtraReports内容方面的文章挺少的, 现讲一下我是如何动态的创建报表。分享给大家
XtraReports报表正常的做法:
制作过程简单说有两步:
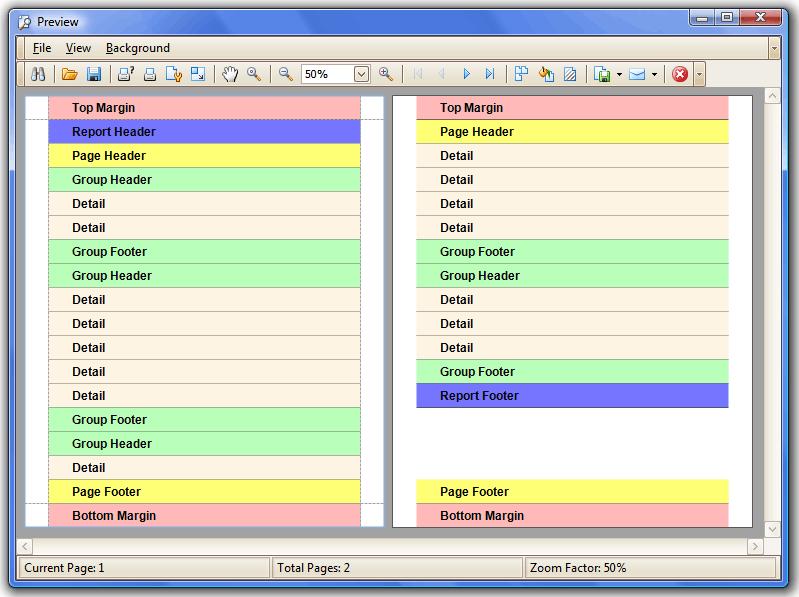
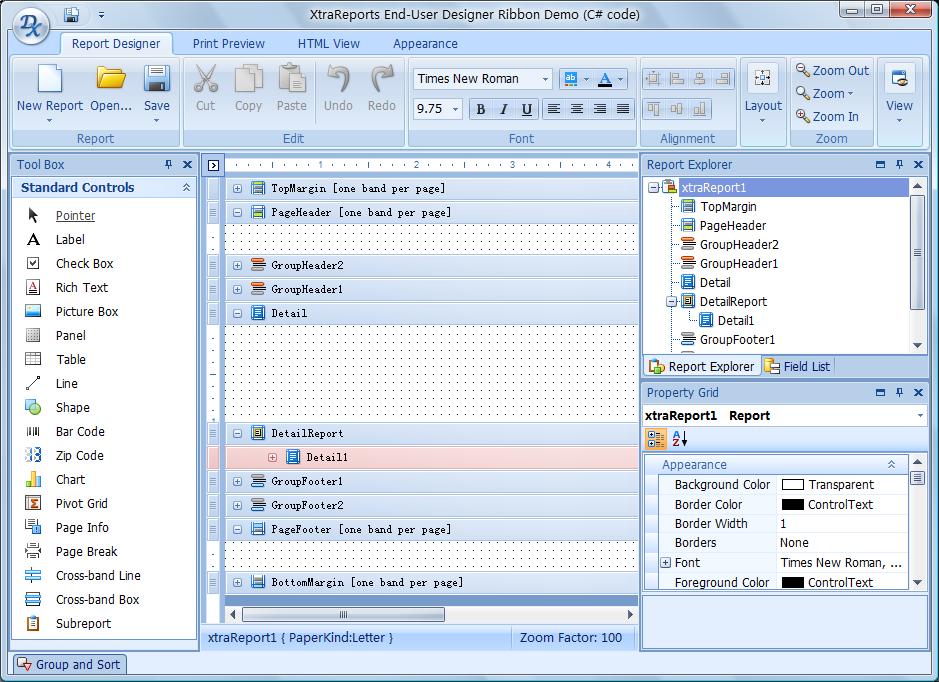
第一步:画报表。报表中有一些带区:报表头,页头,明细,分组,页尾,报表尾等,(报表头、报表尾整个报表中只会加载一次,页头、页尾每一页都会加载一次,其他的就不说了。见图片)

在这些带区中可以放控件,控件在Dev的左边控件栏可以拖拽上去,在属性视图中修改属性,跟WinForm或者WebForm拖拽控件做出一个窗体是类似的。-注意:现在这步画出的只是报表模板

左侧是一些控件 拖入控件可以设置控件的各种属性。
报表设计好文件保存后是.repx 后缀类型的文件,和Winform的窗体保存的 Form1.cs 文件类似。在XtraReport中,每一个报表都是XtraReport或者其子类。如把XtraReport比做Winform。则同样的道理,所有的form都Form类的子类。Dev报表的所有控件都从XRControl继承,XRControl是继承于System.ComponentModel.Component的。Winform的控件都继承于Control类。
第二步:绑定数据源。XtraReport的一个实例 myXtraReport.DataSource = 你的数据源。
这样做先得去设计报表,非常麻烦,而且加入你有几百上上千张表表一一去设计就非常麻烦。
我这篇文章就是想不用去先画报表,直接就生成报表,即运行时生成报表。
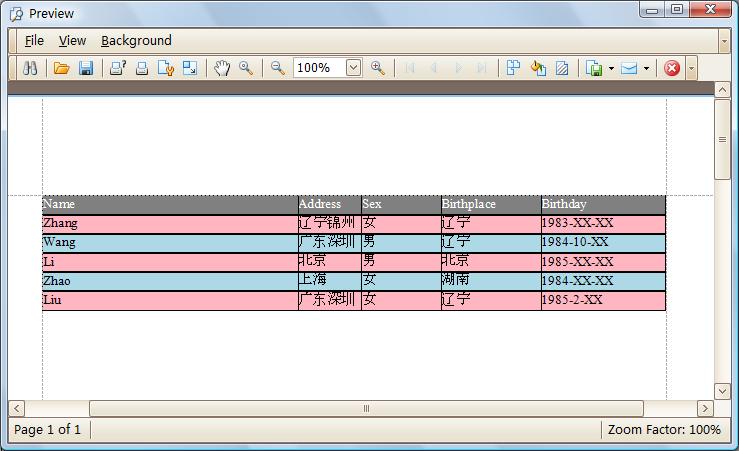
先看一下简单的直接就生成报表的效果

运行时显示一个数据表格中的数据 交替换表格的颜色。
下面是代码
{
InitializeComponent();
this.button1.Click += (o, e) =>
{
XtraReport rpt = new XtraReport();// 建立报表实例
rpt.DataSource = FillDataset();//设置报表数据源
rpt.DataMember = ((DataSet)rpt.DataSource).Tables[0].TableName;
InitBands(rpt);//添加带区(Bands)
InitStyles(rpt);//添加Styles
InitDetailsBasedonXRTable(rpt);//用XRTable显示报表
rpt.ShowPreviewDialog();
};
}
初始化数据源
 FillDataset
{
DataSet myDataSet = new DataSet();
myDataSet.DataSetName = "myDataSet";
DataTable table = new DataTable("Detail");
myDataSet.Tables.Add(table);
table.Columns.Add("Name", typeof(String));
table.Columns.Add("Address", typeof(String));
table.Columns.Add("Sex", typeof(String));
table.Columns.Add("Birthplace", typeof(String));
table.Columns.Add("Birthday", typeof(String));
table.Rows.Add(new object[] { "Zhang", "辽宁锦州", "女", "辽宁", "1983-XX-XX" });
table.Rows.Add(new object[] { "Wang", "广东深圳", "男", "辽宁", "1984-10-XX" });
table.Rows.Add(new object[] { "Li", "北京", "男", "北京", "1985-XX-XX" });
table.Rows.Add(new object[] { "Zhao", "上海", "女", "湖南", "1984-XX-XX" });
table.Rows.Add(new object[] { "Liu", "广东深圳", "女", "辽宁", "1985-2-XX" });
return myDataSet;
}
添加带区
 InitBands
{
DetailBand detail = new DetailBand();
PageHeaderBand pageHeader = new PageHeaderBand();
ReportFooterBand reportFooter = new ReportFooterBand();
detail.Height = 20;
reportFooter.Height = 380;
pageHeader.Height = 20;
rpt.Bands.AddRange(new DevExpress.XtraReports.UI.Band[] { detail, pageHeader, reportFooter });
}
添加Styles
 InitStyles
{
XRControlStyle oddStyle = new XRControlStyle();
XRControlStyle evenStyle = new XRControlStyle();
oddStyle.BackColor = Color.LightBlue;
oddStyle.StyleUsing.UseBackColor = true;
oddStyle.StyleUsing.UseBorders = false;
oddStyle.Name = "OddStyle";
evenStyle.BackColor = Color.LightPink;
evenStyle.StyleUsing.UseBackColor = true;
evenStyle.StyleUsing.UseBorders = false;
evenStyle.Name = "EvenStyle";
rep.StyleSheet.AddRange(new DevExpress.XtraReports.UI.XRControlStyle[] { oddStyle, evenStyle });
}
用XRTable显示报表
 InitDetailsBasedonXRTable
{
DataSet ds = ((DataSet)rpt.DataSource);
int colCount = ds.Tables[0].Columns.Count;
int colWidth = (rpt.PageWidth - (rpt.Margins.Left + rpt.Margins.Right)) / colCount;
// Create a table to represent headers
XRTable tableHeader = new XRTable();
tableHeader.Height = 20;
tableHeader.Width = (rpt.PageWidth - (rpt.Margins.Left + rpt.Margins.Right));
XRTableRow headerRow = new XRTableRow();
headerRow.Width = tableHeader.Width;
tableHeader.Rows.Add(headerRow);
headerRow.BackColor = Color.Gray;
headerRow.ForeColor = Color.White;
// Create a table to display data
XRTable tableDetail = new XRTable();
tableDetail.Height = 20;
tableDetail.Width = (rpt.PageWidth - (rpt.Margins.Left + rpt.Margins.Right));
XRTableRow detailRow = new XRTableRow();
detailRow.Width = tableDetail.Width;
tableDetail.Rows.Add(detailRow);
tableDetail.EvenStyleName = "EvenStyle";
tableDetail.OddStyleName = "OddStyle";
// Create table cells, fill the header cells with text, bind the cells to data
for (int i = 0; i < colCount; i++)
{
XRTableCell headerCell = new XRTableCell();
headerCell.Width = colWidth;
headerCell.Text = ds.Tables[0].Columns[i].Caption;
XRTableCell detailCell = new XRTableCell();
detailCell.Width = colWidth;
detailCell.DataBindings.Add("Text", null, ds.Tables[0].Columns[i].Caption);
if (i == 0)
{
headerCell.Borders = DevExpress.XtraPrinting.BorderSide.Left | DevExpress.XtraPrinting.BorderSide.Top | DevExpress.XtraPrinting.BorderSide.Bottom;
detailCell.Borders = DevExpress.XtraPrinting.BorderSide.Left | DevExpress.XtraPrinting.BorderSide.Top | DevExpress.XtraPrinting.BorderSide.Bottom;
}
else
{
headerCell.Borders = DevExpress.XtraPrinting.BorderSide.All;
detailCell.Borders = DevExpress.XtraPrinting.BorderSide.All;
}
// Place the cells into the corresponding tables
headerRow.Cells.Add(headerCell);
detailRow.Cells.Add(detailCell);
}
// Place the table onto a report's Detail band
rpt.Bands[BandKind.PageHeader].Controls.Add(tableHeader);
rpt.Bands[BandKind.Detail].Controls.Add(tableDetail);
}
之后还会添加报表头和报表尾,页统计分组统计等。
通过我给的代码相信大家 添加报表头和报表尾,页统计分组统计 也会模仿着动态加载出来。
这篇文章通过几个小时修修改改的,终于觉得差不多了,决定要封版本了,(做的东西总 觉得这里不满意那里还不满意,软件封版难啊![]() ) 希望能给需要的人带来帮助!
) 希望能给需要的人带来帮助!
