高斯分布,也叫正态分布,是一个在数学、物理及工程等领域都非常重要的概率分布,在统计学的许多方面有着重大的影响力。
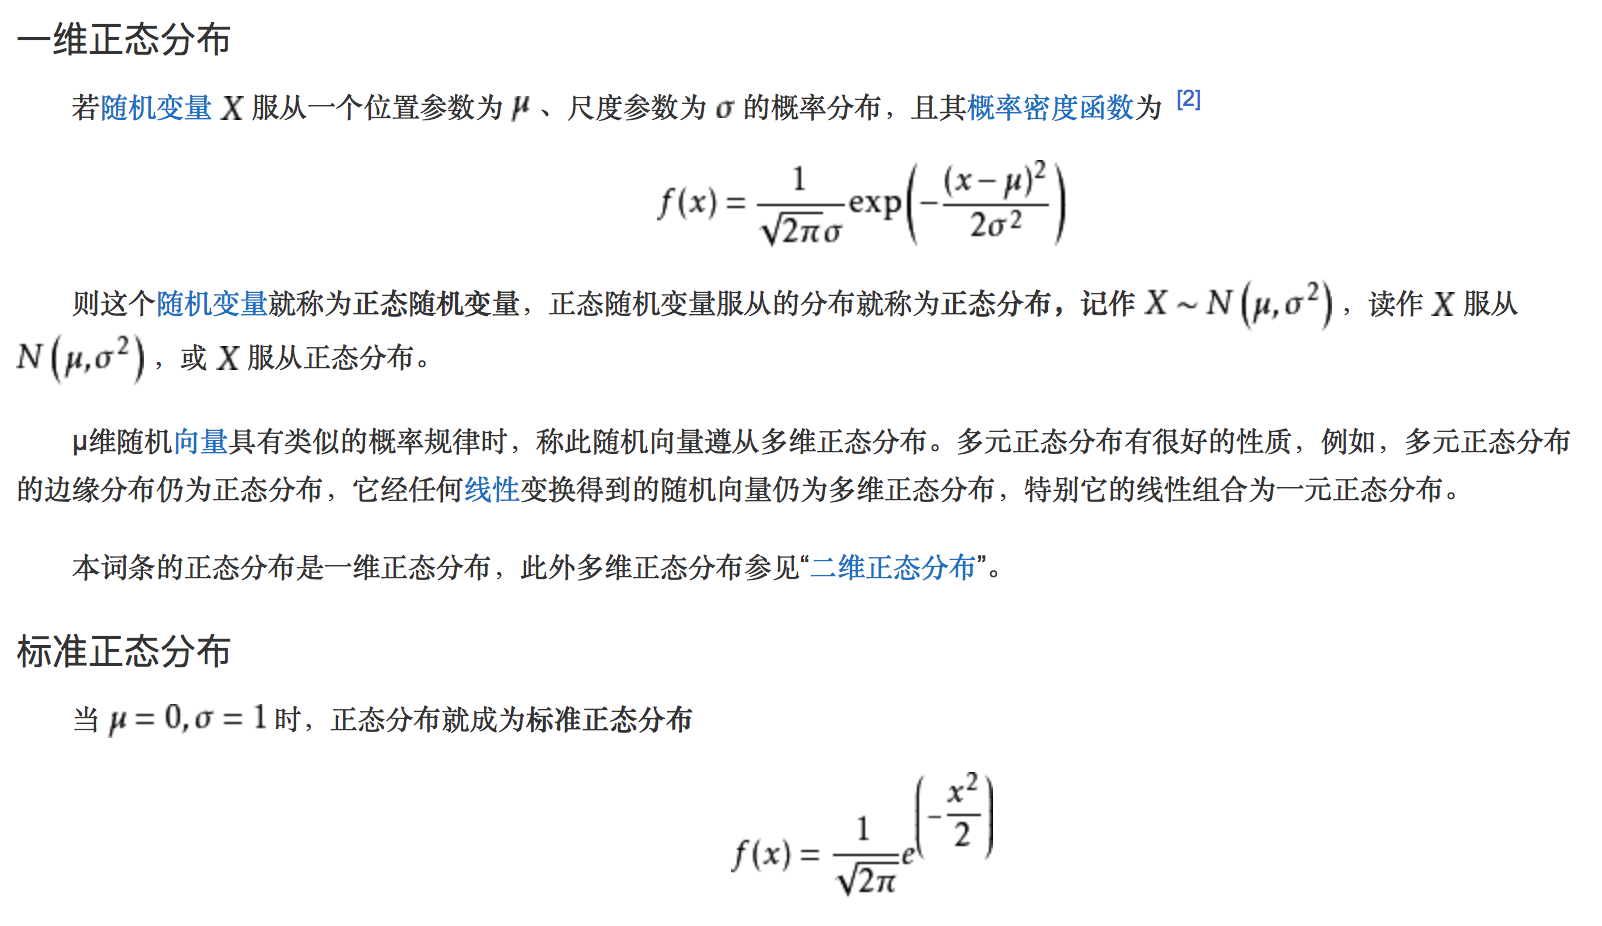
若随机变量X服从一个数学期望为μ、方差为σ^2的正态分布,记为N(μ,σ^2)。其概率密度函数为正态分布的期望值μ决定了其位置,其标准差σ决定了分布的宽度。当μ = 0,σ = 1时的正态分布是标准正态分布。
定义
---------以上摘自百度百科
import numpy as np
import matplotlib.pyplot as plt
import math
def normal_distribution(x, mean, sigma):
return np.exp(-1*((x-mean)**2)/(2*(sigma**2)))/(math.sqrt(2*np.pi) * sigma)
mean1, sigma1 = 0, 1
x1 = np.linspace(mean1 - 6*sigma1, mean1 + 6*sigma1, 100)
mean2, sigma2 = 0, 2
x2 = np.linspace(mean2 - 6*sigma2, mean2 + 6*sigma2, 100)
mean3, sigma3 = 5, 1
x3 = np.linspace(mean3 - 6*sigma3, mean3 + 6*sigma3, 100)
y1 = normal_distribution(x1, mean1, sigma1)
y2 = normal_distribution(x2, mean2, sigma2)
y3 = normal_distribution(x3, mean3, sigma3)
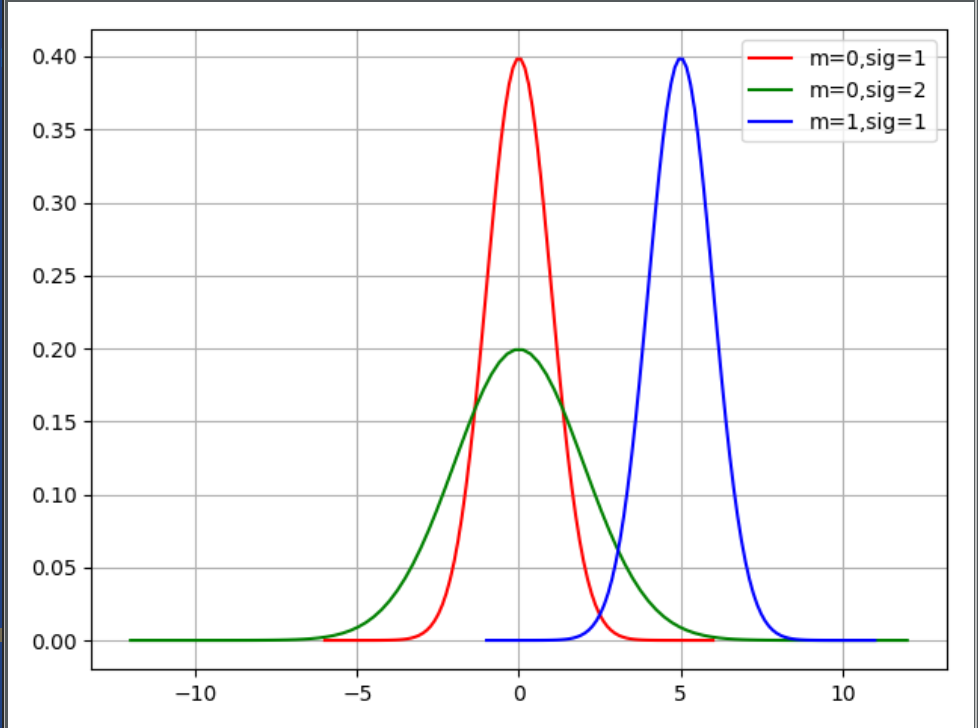
plt.plot(x1, y1, 'r', label='m=0,sig=1')
plt.plot(x2, y2, 'g', label='m=0,sig=2')
plt.plot(x3, y3, 'b', label='m=1,sig=1')
plt.legend()
plt.grid()
plt.show()