一、简介
Hystrix Dashboard是Hystrix的一个组件,Hystrix Dashboard提供一个断路器的监控面板,可以使我们更好的监控服务和集群的状态,仅仅使用Hystrix Dashboard只能监控到单个断路器的状态,实际开发中还需要结合Turbine使用。
二、Hystrix Dashboard的使用
1、添加依赖
<dependency>
    <groupId>org.springframework.boot</groupId>
    <artifactId>spring-boot-starter-actuator</artifactId>
</dependency>
<dependency>
    <groupId>org.springframework.cloud</groupId>
    <artifactId>spring-cloud-starter-hystrix-dashboard</artifactId>
</dependency>
2、Springboot Application中添加注解,并启动程序
@EnableHystrixDashboard //开启Dashboard
3、查看面板
/health端点查看服务状态
/hystrix.stream端点查看指标流
浏览器中打开http://localhost:9999/hystrix 
图中提示数据源有三种:
http://turbine-hostname:port/turbine.stream (所有集群)
http://turbine-hostname:port/turbine.stream?cluster=[clusterName](指定名称的集群)
http://hystrix-app:port/hystrix.stream(单个应用)
我们选择第三个,点击Moitor Stream会自动生成监控面板,我们就可以实时监控数据 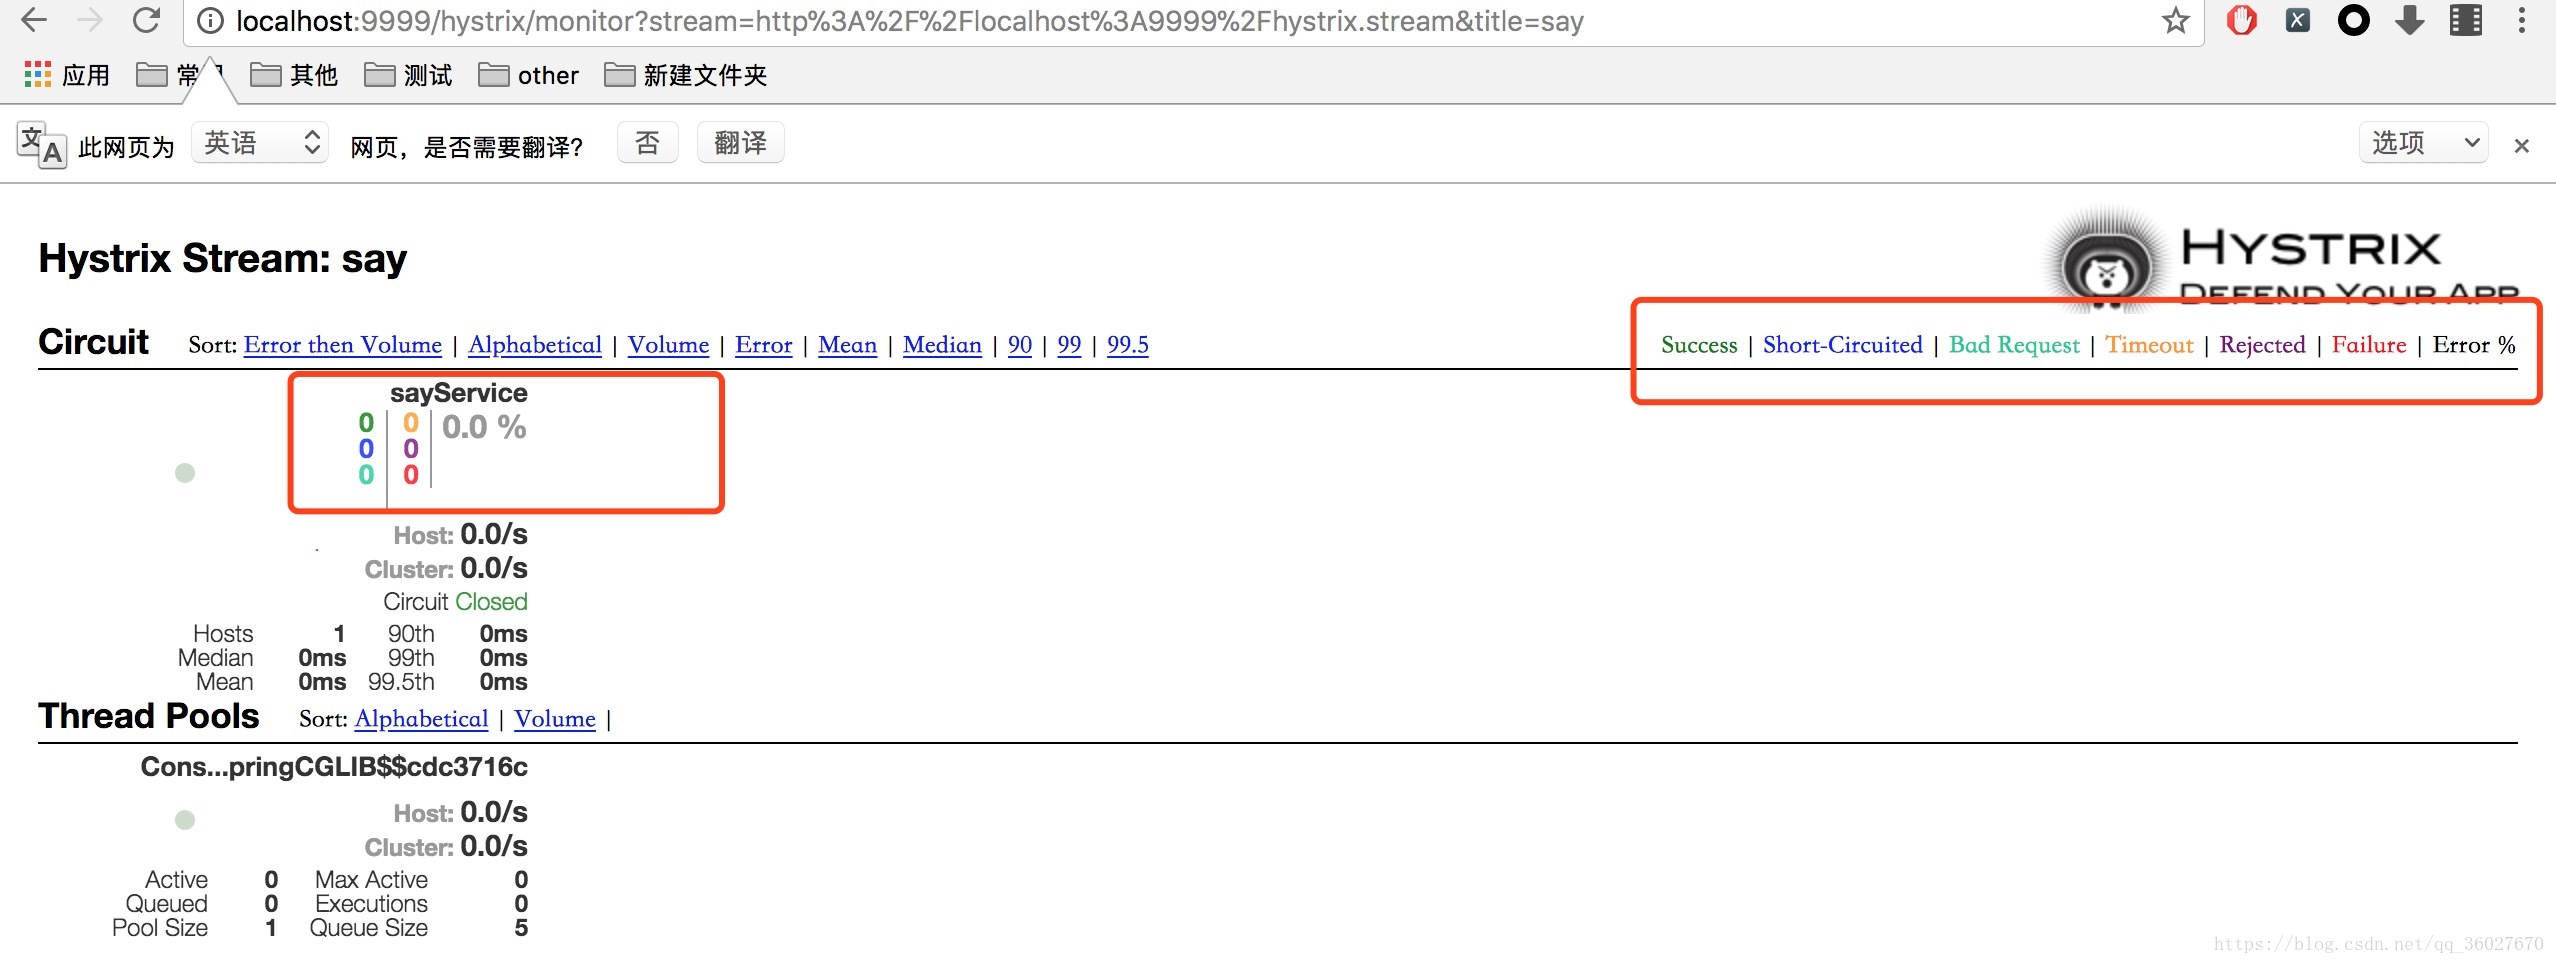
如果处于loading data状态,是因为没有数据,调用服务就可以加载数据了。
注意:在Feign负载均衡中使用Hystrix Dashboard,一定需要配置打开断路器,如下:
feign.hystrix.enabled=true