图表组件Chart.js是Bootstrap比较好用的组件之一,与一款收费的组件highchart类似,效果上来看免费与收费的产品相差还是有一点点的,不过功能上差不多能满足我们项目的需要。下面这段JS脚本主要是为了方便生成一个图表的配置而写的方法
 1   /**
 2        * 获取一个新的chart配置项
 3        * @param color rgba颜色
 4        * @param type 图表类型:line,bar,radar,polarArea,pie,doughnut
 5        * @param title 显示图表的标题
 6        * @param label 图表的标签,鼠标移到图表某个数据点时显示的提示文字
 7        * @param categories 一般是X轴的内容
 8        * @param data  一般是Y轴的数据
 9        * @returns 返回图表的配置参数
10        */
11     function getNewConfig(color,type,title,label,categories,data)
12     {
13       var background = color;
14       var config = {
15         type: type,
16         options: {
17           responsive: true,
18           legend: {
19             display: false,
20             position:'bottom'
21           },
22           hover: {
23             mode: 'label'
24           },
25           scales: {
26             xAxes: [{
27               display: true,
28               scaleLabel: {
29                 display: false,
30                 labelString: 'Month'
31               }
32             }],
33             yAxes: [{
34               display: true,
35               scaleLabel: {
36                 display: false,
37                 labelString: 'Value'
38               }
39             }]
40           },
41           title: {
42             display: true,
43             text: title
44           }
45         }
46       };
47
48       var dataset = {
49         label: label,
50         data: data,
51         fill: false,
52         borderDash: [5, 5],
53         borderColor : background,
54         backgroundColor : background,
55         pointBorderColor : background,
56         pointBackgroundColor : background,
57         pointBorderWidth : 1
58       };
59       var data =  {
60         labels:categories,
61         datasets: [dataset]
62       };
63       config.data = data;
64       return config;
65     }
调用方法:
<canvas id="chart_weixinmember" height="100"></canvas>
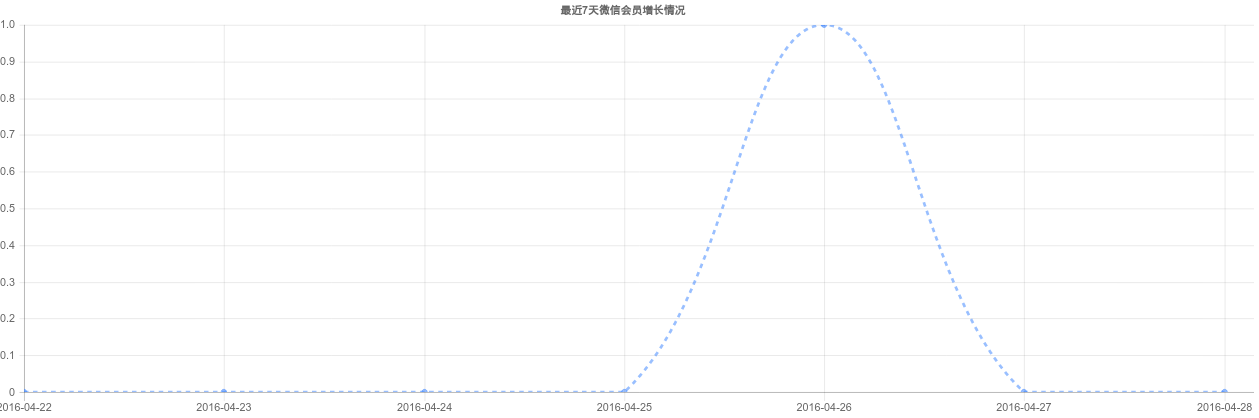
1         var color = 'rgba(51,126,255,0.5)';
2         var categories = ["2016-04-22","2016-04-23","2016-04-24","2016-04-25","2016-04-26","2016-04-27","2016-04-28"];
3         var data = [0,0,0,0,1,0,0];
4         var config = getNewConfig(color,'line','最近7天微信会员增长情况','当天新增微信会员',categories,data);
5         var ctx = document.getElementById("chart_weixinmember").getContext("2d");
6         var weixinMemberCountChart = new Chart(ctx, config);
显示的效果:
说明:使用上面的代码需要引用Chart.js,
Chart中文网站以及文档:
http://www.bootcss.com/p/chart.js/
http://www.bootcss.com/p/chart.js/docs/
Chart英文网站及文档:
www.chartjs.org
www.chartjs.org/docs