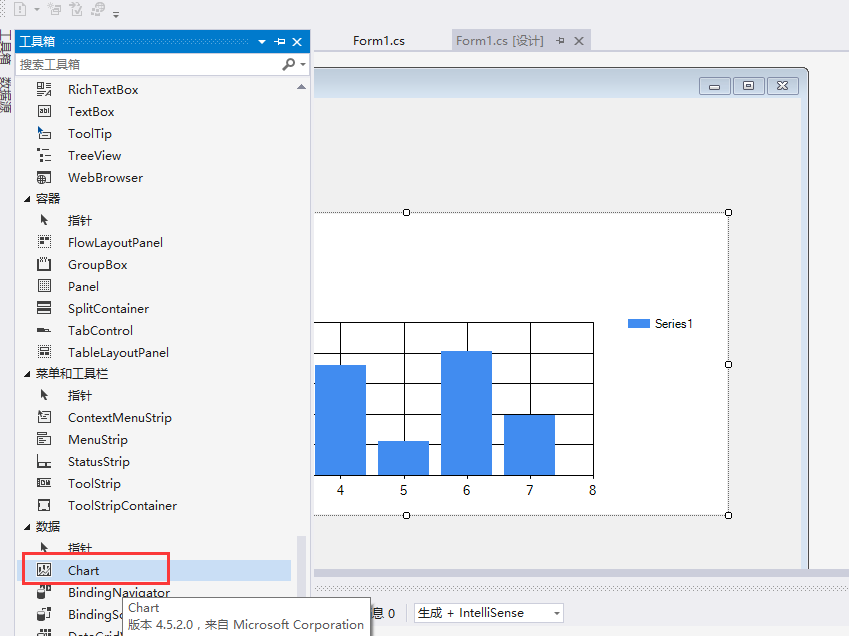
1.拖控件Chart 到界面
2. 清除默认的序列
chart1.Series.Clear();
3.生成一个序列,并添加到chart1中,序列可添加多个
Series s1 = new Series();
s1.Name = "序列名";
chart1.Series.Add(s1);
4.使用list绑定数据
List<int> Hdop = new List<int> { 1, 2, 3, 4, 5, 6, 7 };//x轴
List<int> Vdop = new List<int> { 1, 2, 3, 4, 5, 6, 7 };//y轴 可以是时间各种
chart1.Series["序列名"].Points.DataBindXY(Hdop, Vdop);
5.修改单独的柱子
chart1.Series["序列名"].Points[索引].Label = "标注符号";// 柱子上的文字
chart1.Series["序列名"].Points[索引].Color = Color.Red;//标注的柱子颜色效果如下
