zoukankan      html  css  js  c++  java
  • echarts的饼图,关于指示线单独显示以及全部显示的配置

     const option = {
          title: {
            text: canvasStyles.name,
            x: 'center',
            y: 'center',
            textStyle: {
              color: '#fff',
              fontSize: 12
            }
          },
          tooltip: {
            show: false
            // trigger: 'item',
            // formatter: function(e) {
            //   var res = `<div>${e.data.name}:${e.data.value}</div>`;
            //   return res;
            // },
            // position: function(pos, params, dom, rect, size) {
            //   var data = params.data;
            //   var sHtml = `<div style="background:orange>555</div>`;
            //   console.log(dom);
            //   console.log(pos);
            //   console.log(params);
            //   console.log(dom);
            //   console.log(rect);
            //   console.log(size);
            //   return sHtml;
            // }
            //extraCssText: 'background:orange;transform:rotate(40deg)'
          },
          grid: {
            top: '15%'
          },
          legend: {
            orient: canvasStyles.legendOrient || 'vertical',
            //x: canvasStyles.legendX,
            y: canvasStyles.legendY,
            right: canvasStyles.right || 0,
            data: canvasStyles.legend,
            itemWidth: 15,
            itemHeight: 10,
            itemGap: 5,
            formatter: function(name) {
              return name.length > 5 ? name.substr(0, 5) + '...' : name;
            },
            textStyle: {
              color: '#fff',
              fontSize: 10
            }
          },
          color: canvasStyles.color,
          series: [
            {
              name: '房屋状态',
              type: 'pie',
              radius: ['40%', '48%'],
              center: ['50%', '50%'],
              minAngle: 12,
              avoidLabelOverlap: false,
              label: {
                normal: {
                  show: false,
                  formatter: '{c|{c}} ({d|{d}%})
    {hr|}
    {a|{a}}',
                  lineStyle: {
                    color: 'yellow',
                     2
                  },
                  rich: {
                    a: {
                      padding: 4
                    },
                    b: {
                      fontSize: 12,
                      align: 'left',
                      padding: 82,
                      margin: 80,
                      lineHeight: 80
                    },
                    hr: {
                      borderColor: '#4681ec',
                       '100%',
                      borderWidth: 2,
                      height: 0
                    },
                    d: {
                      fontSize: 12,
                      align: 'left',
                      padding: 4
                    },
                    c: {
                      fontSize: 12,
                      align: 'left'
                    }
                  }
                },
                emphasis: {
                  position: 'left',
                  show: true,
                  textStyle: {
                    fontSize: '14',
                    fontWeight: 'bold'
                  },
                  length: 1
                }
              },
              // avoidLabelOverlap: false,
              // label: {
              //   normal: {
              //     show: false,
              //     position: 'center',
              //     formatter: canvasStyles.tipNameType == '' || !canvasStyles.tipNameType ? '{b}
    {c}' : '' + canvasStyles.tipNameType + '
    {b}
    {c}'
              //   },
              //   emphasis: {
              //     show: true,
              //     textStyle: {
              //       fontSize: '14',
              //       fontWeight: 'bold'
              //     }
              //   }
              // },
              // labelLine: {
              //   normal: {
              //     show: false
              //   }
              // },
              data: canvasStyles.data
            }
          ]
        };


      总结:

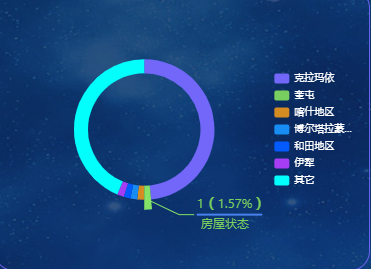
    1,series里面的label的normal的show为true的时候是全部指示线都显示,为false的时候只显示一个

    2.formatter: '{c|{c}} {hr|} {d|{d}%}',  配合地下的rich可以个性化定制指示线的样式

    3

    minAngle: 12, //设置上面最小区域的范围
    avoidLabelOverlap: false, 当为false的时候文字是可以重合的,但是配合上面normal的show为false的时候
     可以防止线过长
     
  • 相关阅读:
    Pycharm 调试system-config-users
    只写了两行代码,为什么要花两天时间?
    为开源做贡献的6个技巧
    2020年10月编程语言排行榜
    全球最厉害的 14 位程序员
    6_38_二叉树的后序遍历非递归算法(和先序有些许不一样)
    6_37_二叉树的先序遍历非递归算法
    6_36_相似二叉树
    6_33_两个一维数组判断u是否为v的子孙
    6_34_扩展判断u是否为v的子孙
  • 原文地址:https://www.cnblogs.com/lsc-boke/p/11114556.html
Copyright © 2011-2022 走看看