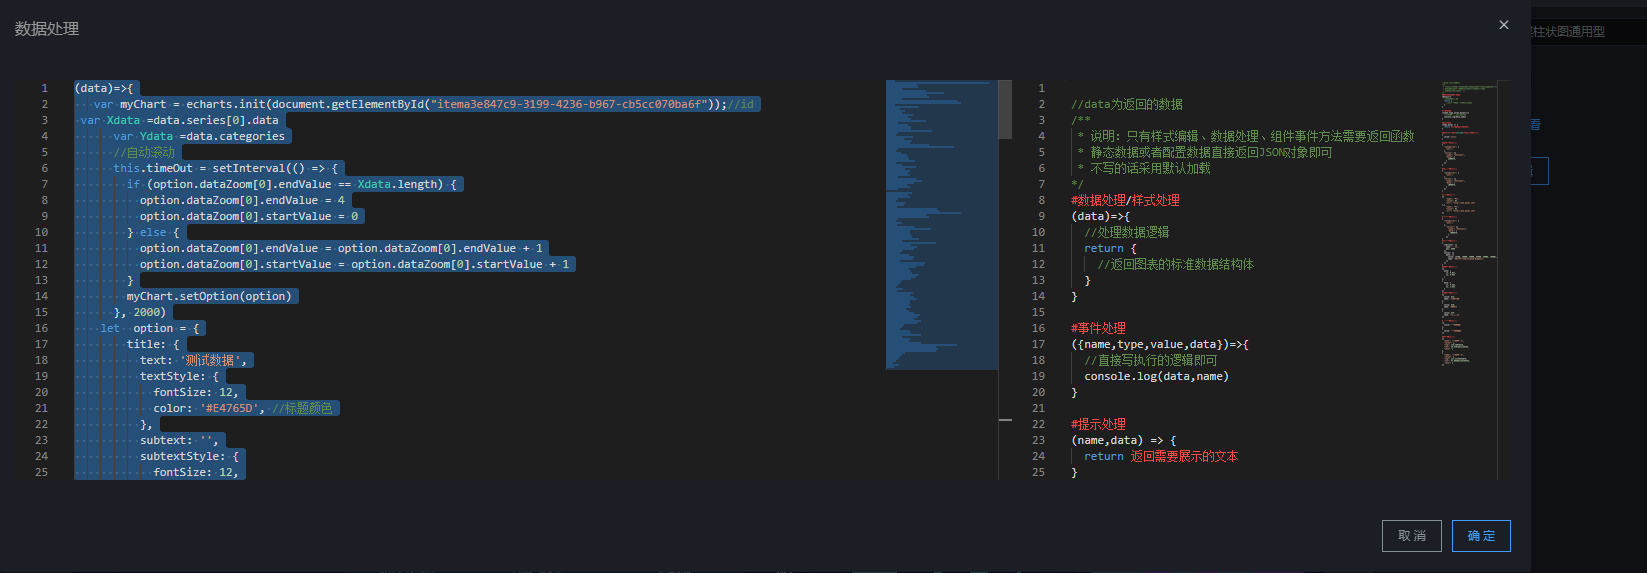
zoukankan      html  css  js  c++  java
  • avue大屏 avuedata echarts图形数据过多自动滚动

     效果图演示:


    大屏通用柱状图编辑界面:


      代码如下:(准备需要的id)

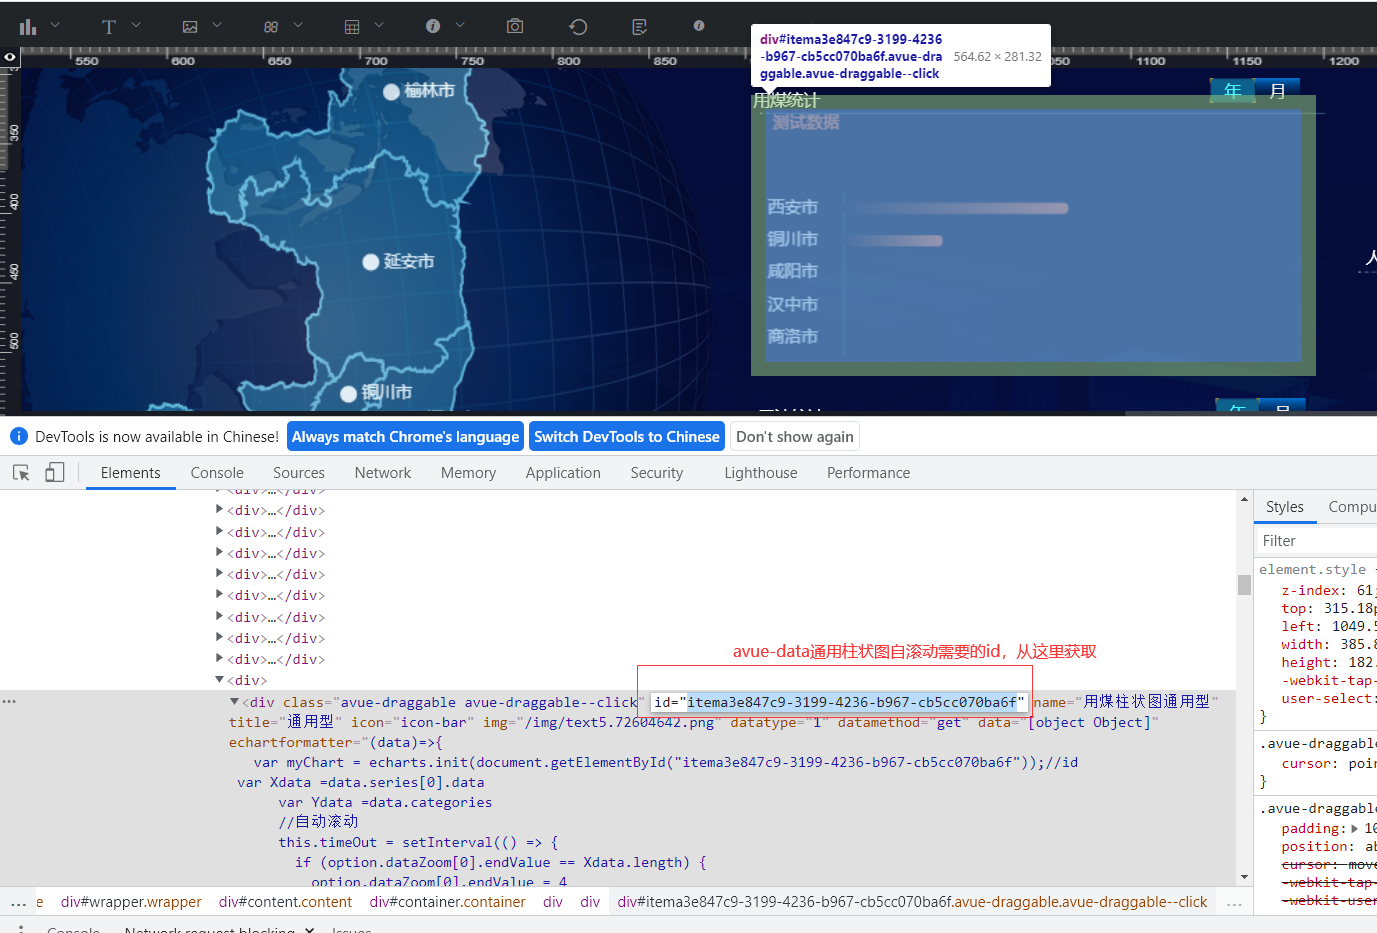
    (data)=>{
         let myChart = echarts.init(document.getElementById("itema3e847c9-3199-4236-b967-cb5cc070ba6f"));//avue-data通用柱状图自滚动需要的id
        let Xdata = ['63.27','27.90','33.52','17.98','42.25','24.54','33.96','11.73','72.58','45.36',]
    let Ydata =['西安市','铜川市','咸阳市','汉中市','商洛市','安康市','渭南市','宝鸡市','延安市','榆林市',]
    //自动滚动
          this.timeOut = setInterval(() => {
            if (option.dataZoom[0].endValue == Xdata.length) {
              option.dataZoom[0].endValue = 4
              option.dataZoom[0].startValue = 0
            } else {
              option.dataZoom[0].endValue = option.dataZoom[0].endValue + 1
              option.dataZoom[0].startValue = option.dataZoom[0].startValue + 1
            }
            myChart.setOption(option)
          }, 2000)
        let  option = {
            title: {
              text: '测试数据',
              textStyle: {
                fontSize: 12,
                color: '#E4765D', //标题颜色
              },
              subtext: '',
              subtextStyle: {
                fontSize: 12,
                color: '#E4765D', //副标题标题颜色
              },
            },
            color: ['#3398DB'],
            tooltip: {
              trigger: 'axis',
              axisPointer: {
                // 坐标轴指示器,坐标轴触发有效
                type: 'shadow', // 默认为直线,可选为:'line' | 'shadow'
              },
            },
            grid: {
              left: '3%',
              right: '4%',
              bottom: '3%',
              containLabel: true,
            },
            xAxis: {
              //坐标轴类型(类目轴)
              name: '',
              type: 'value',
              axisLabel: {
                show: false,
              },
              //是否显示坐标轴刻度
              axisTick: { show: false },
              //坐标轴线线的颜色
              axisLine: {
                show: false,
              },
    
              //是否显示网格线
              splitLine: {
                show: false,
              },
            },
            dataZoom: [
              //滑动条
              {
                yAxisIndex: 0, //这里是从X轴的0刻度开始
                show: false, //是否显示滑动条,不影响使用
                type: 'slider', // 这个 dataZoom 组件是 slider 型 dataZoom 组件
                startValue: 0, // 从头开始。
                endValue: 4, // 一次性展示5个。
              },
            ],
            yAxis: [
              {
                type: 'category',
                inverse: true, //是否是反向坐标轴
                data: Ydata,
                axisLabel: {
                  show: true,
                  textStyle: {
                    color: '#ffffff',
                  },
                  formatter: function (value, index) {
                    var value
                    // if判断转换值
                    return value
                  },
                },
                offset: 10,
                nameTextStyle: {
                  fontSize: 15,
                },
                splitLine: { show: false },
                axisTick: { show: false },
                //坐标轴线线的颜色
                axisLine: {
                  show: true,
                  lineStyle: {
                    color: '#0E3B57',
                    type: 'solid',
                     1,
                  },
                },
              },
            ],
            series: [
              {
                name: '用煤量',
                type: 'bar',
                barMaxWidth: 10,
                // barWidth: "60%",
                data: Xdata,
                barWidth: 8,
                barGap: 10,
                smooth: true,
                label: {
                  normal: {
                    show: false,
                    position: 'right',
                    offset: [5, -2],
                    textStyle: {
                      color: '#F68300',
                      fontSize: 13,
                    },
                  },
                },
                itemStyle: {
                  emphasis: {
                    barBorderRadius: 7,
                  },
                  //颜色渐变
                  normal: {
                    barBorderRadius: 7,
                    color: new echarts.graphic.LinearGradient(0, 0, 1, 0, [
                      { offset: 0, color: '#040C3B' },
                      { offset: 0.5, color: '#6D3F46' },
                      { offset: 1, color: '#E4765D' },
                    ]),
                  },
                },
              },
            ],
          }
    return option
            
    }

    想要了解更多avue大屏的知识,记得私信我哦。


  • 相关阅读:
    python程序设计练习题:电子银行购物商城
    python -m参数
    Python 中的 if __name__ == 'main' 的作用和原理
    Modbus协议
    Python configparser模块
    Python logging 模块:日志处理
    python hashlib模块
    Python time模块:Python 日期和时间
    mac 使用系统的自带的quickTime录屏
    Linphone android3.2.4 采用率设置(模拟电话大网信道)
  • 原文地址:https://www.cnblogs.com/luckybaby519/p/15682365.html
Copyright © 2011-2022 走看看