Debugging JavaScript in Your Applications
Introduction:
Of all the languages we use on a daily basis as Domino Developers JavaScript has to be the trickiest of them all to debug. It's not necessarily that it's any harder than the other languages to debug, it's just that Internet Explorer doesn't really help us out. For example. Take this typical error dialog: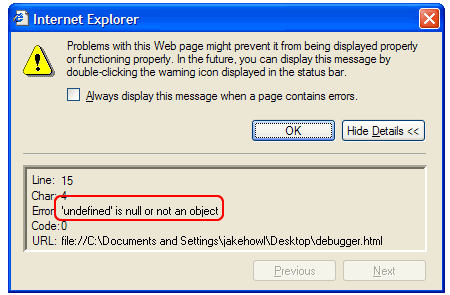
The error message tells us almost nothing. After a while you start to get to know what each one might mean, but for the novice this is all but meaningless. It does provide the line number that the error happened on but trying to find this actual line is not always as easy as you might think. The line number includes all lines of JavaScript that happen to be included, as well as blank lines and whatnot.
So what do we do at this point? I sometimes find myself adding alert() boxes at strategic points in the code. You can use these prompts to tell us the values of certain variables as the code progresses. Eventually, if you're lucky, you'll discover what was causing the problem. This is no way to work though. It wastes too much time! We need to find the error fast. This article aims to describe a way of doing so.
A Simple Example:
Most JavaScript errors turn out to be really simple mistakes. Most often they are typos. Sometimes things are a lot more obscure but I will keep it simple here.
Take the form below, used for adding two numbers, as an example. Just three fields and a button: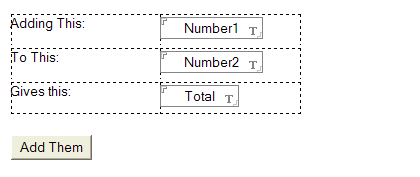
Now look at the code I wrote for the onclick event of the button. All it has to do is add the values in the first two fields and place the sum in the third:function addThemUp(frm){
var i1 = frm.Number1.value;
var i2 = frm.Number2.value;
var fld = frm.total;
fld.value = i1 + i2;
}
Can you see my error already? Most of you probably can. For those who can't, the most valuable lesson to learn about JavaScript is that it's case-sensitive and this is the cause of endless errors. In this example I have called my field "Total" and refered to is as "frm.total" in the code. This is the cause of my "undefined" error. JavaScript looks for an object called "total" on the form and can't find it. Hence this reference is "undefined".
You might think I've spoilt the fun of describing how we go about finding the error. Well, not really - it's never fun. This article isn't a lesson in the theory of debugging. It's an article to describe the practice of debugging. Knowing how to debug effectively is something you either have or you have to pick up over the years and is well beyond the scope of this article.
Debugging the JavaScript:
The first essential step in debugging your code is getting your hands on a debugger. Microsoft give it away for free and you can get it here. Download and install a copy of Script Debugger before you carry on. You can't do much without it.
With Script Debugger installed, relaunch the browser and press the button again, you will see the same error message but a different dialog box, as below: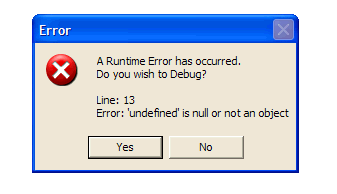
If you click Yes the Script Debugger window will open and take you to the line of code that is causing problems.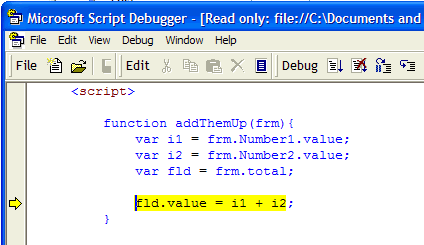
No more guessing which line it is. You know the exact line where the error occurred.
Taking it one step further:
Now that we know where the error is we can delve deeper to see what actually caused it. To do this we want to halt the code before the error and do some investigation. This is a simple case of adding the "debugger" keyword to your code, just before the line causing the error, as in the following example: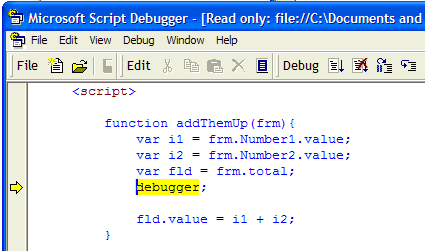
When Internet Explorer encounters this line it stops executing the script and launches the debugger. This is what has happened in the above screen-shot.
So, what do we do now we've paused it? Well, we need to find out exactly what it is that's undefined. To do this we can use the Command Window. From this little window you can easily check and re-assign values (at "run-time") to any of the variables that have been defined. Launch it from the View menu of the debugger or by clicking the button on the very right-hand-side of the toolbar.
To use the Command Window to check a variable's value you simply type in its name and press enter. In the shot below you can see that, one by one I've typed in the names of the variables in my function to test their values. The command window will return the value it associates with that variable on the line below. For i1 and i2 in this example you can see it contains the strings "12" and "56" but it tells us the variable called "fld" is undefined! Here lies our problem: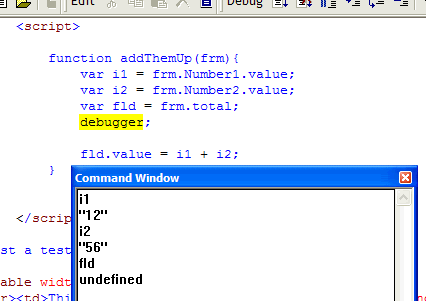
Let's allow the code continue running and we can think this over. To do this you can either close the debugger or press F5. You will still see the error though! This is because fld is still undefined.
At this point you may well have that eureka moment and see the problem straight-away. If that's the case then you simply correct the code and pretend it never happened. Otherwise, we need to take this approach one step further. You can also re-assign variables from the Command Window. If you do this, then press F5 and see no errors, all is well. Once you've found the solution you can fix your code. Consider the lines in the Command Window in the screen-shot below: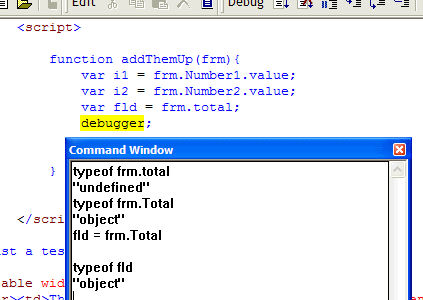
Using the typeof operator, I first check to see what it thinks the frm.total object is. As suspected, it's an undefined onject. On a hunch I try testing the typeof frm.Total, to see if I didn't give the field a capital initial. Eureka! frm.Total is an object and more than likely the field