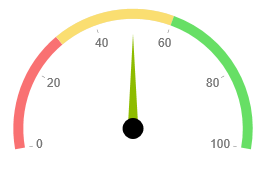
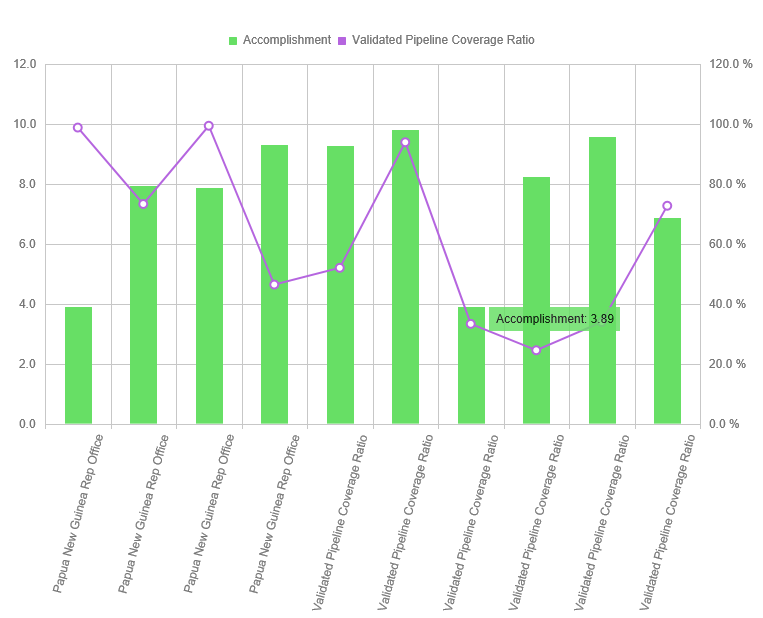
一说到kendeodui我相信大家一定不陌生,这套js在画图方面效果也不错。
现在来看一看 仪表盘和柱状图的效果吧:


html和js代码如下:

<!DOCTYPE html>
<html xmlns="http://www.w3.org/1999/xhtml">
<head>
    <title>kendoui DEmo</title>
    <link type="text/css" rel="stylesheet" href="kendoui/styles/kendo.common.min.css" />
    <link type="text/css" rel="stylesheet" href="kendoui/styles/kendo.dataviz.metro.min.css" />

    <script type="text/javascript" src="kendoui/js/jquery.min.js"></script>
    <script type="text/javascript" src="kendoui/js/kendo.all.min.js"></script>

</head>
<body>
    <div>

        <div class="js-gauge" style=" 250px; height:200px"></div>
        <div class="js-chart" style=" 750px; height:600px"></div>
    </div>
    <script type="text/javascript">
        var ranges = [{
            from: 0,
            to: 30,
            color: "#F97172"
        }, {
            from: 30,
            to: 60,
            color: "#FADE71"
        }, {
            from: 60,
            to: 100,
            color: "#67DF65"
        }];


        $(".js-gauge").kendoRadialGauge({
            theme: 'metro',
            pointer: {
                value: 50,
                cap: {
                    size: 0.1,
                    color: "black"
                }
            },
            scale: {
                minorUnit: 20,
                majorTicks: {
                    size: 3
                },
                startAngle: -10,
                endAngle: 190,
                max: 100,
                labels: {
                    visible: true,
                    position: "inside",
                },
                rangeSize: 10,
                ranges: ranges
            }
        });

        $(".js-chart").kendoChart({
            theme: 'metro',
            legend: {
                position: "top"
            },
            seriesDefaults: {
                type: "column"
            },
            series: [{
                name: "Accomplishment",
                color: "#67DF65",
                axis: "number",
                data: [3.907, 7.943, 7.848, 9.284, 9.263, 9.801, 3.890, 8.238, 9.552, 6.855],
                tooltip: {
                    visible: true,
                    format: "{0:p1}",
                    template: "#= series.name #: #= kendo.toString(value,'n2') #"
                }
            }, {
                type: "line",
                color: "#B565DF",
                axis: "percent",
                name: "Validated Pipeline Coverage Ratio",
                data: [0.988, 0.733, 0.994, 0.464, 0.52, 0.939, 0.333, 0.245, 0.339, 0.727],
                tooltip: {
                    visible: true,
                    format: "{0:p1}",
                    template: "#= series.name #: #= kendo.toString(value,'p2') #"
                }
            }],
            valueAxis: [{
                name: 'number',
                labels: {
                    format: "{0:n1}"
                },
                line: {
                    visible: false
                }
            }, {
                name: 'percent',
                labels: {
                    format: "{0:p1}"
                },
                line: {
                    visible: false
                }
            }],
            categoryAxis: {
                categories: ['Papua New Guinea Rep Office', 'Papua New Guinea Rep Office', 'Papua New Guinea Rep Office', 'Papua New Guinea Rep Office', 'Validated Pipeline Coverage Ratio', 'Validated Pipeline Coverage Ratio', 'Validated Pipeline Coverage Ratio', 'Validated Pipeline Coverage Ratio', 'Validated Pipeline Coverage Ratio', 'Validated Pipeline Coverage Ratio'],
                line: {
                    visible: true
                },
                labels: {
                    rotation: -75
                },
                axisCrossingValues: [0, 10]
            },
            tooltip: {
            }
        });
    </script>
</body>
</html>
相关代码下载http://download.csdn.net/detail/dz45693/7647501
