使用方法:
python3 generatorSentinelLog2Html.py sentinelLogFileName
源码
#! /usr/bin/env python
# -*- coding: utf-8 -*-
import sys
def printSentinel():
filename = sys.argv[1]
# 数据集合 {'资源名称':[[时间],[通过的qps],[拦截的qps],[exit qps]]}
dataDict = {}
# 所有资源的名称集合
all_resource_name = []
with open(filename, 'r', encoding='UTF-8') as file_to_read:
for line in file_to_read:
_, _time_line, resources_name, _pass_qps_line, _blocked_qps_line, _exit_qps_line, _, _, _, _, _ = [
str(i) for i in line.split('|')]
# 如果是新的资源名称,则初始化
if resources_name not in dataDict.keys():
dataDict[resources_name] = [[], [], [], []]
all_resource_name.append(resources_name)
dataDict[resources_name][0] = []
dataDict[resources_name][1] = []
dataDict[resources_name][2] = []
dataDict[resources_name][3] = []
dataDict[resources_name][0].append(_time_line)
dataDict[resources_name][1].append(_pass_qps_line)
dataDict[resources_name][2].append(_blocked_qps_line)
dataDict[resources_name][3].append(_exit_qps_line)
# 输出到 html 中
for name in all_resource_name:
time_line = dataDict[name][0]
pass_qps_line = dataDict[name][1]
blocked_qps_line = dataDict[name][2]
exit_qps_line = dataDict[name][3]
outHtmlFile(name, time_line, pass_qps_line, blocked_qps_line, exit_qps_line)
# 生成报表页面
def outHtmlFile(file_name, time_line, pass_qps_line, blocked_qps_line, exit_qps_line):
content = '''
<!DOCTYPE html>
<html style="height: 100%">
<head>
<meta charset="utf-8">
</head>
<body style="height: 100%; margin: 0">
<div id="container" style="height: 100%"></div>
<script type="text/javascript" src="https://cdn.jsdelivr.net/npm/echarts@5/dist/echarts.min.js"></script>
<script type="text/javascript">
var dom = document.getElementById("container");
var myChart = echarts.init(dom);
var app = {};
var option;
option = {
color: ["#2E8B57", "#DC143C", "#1E90FF"],
title: {
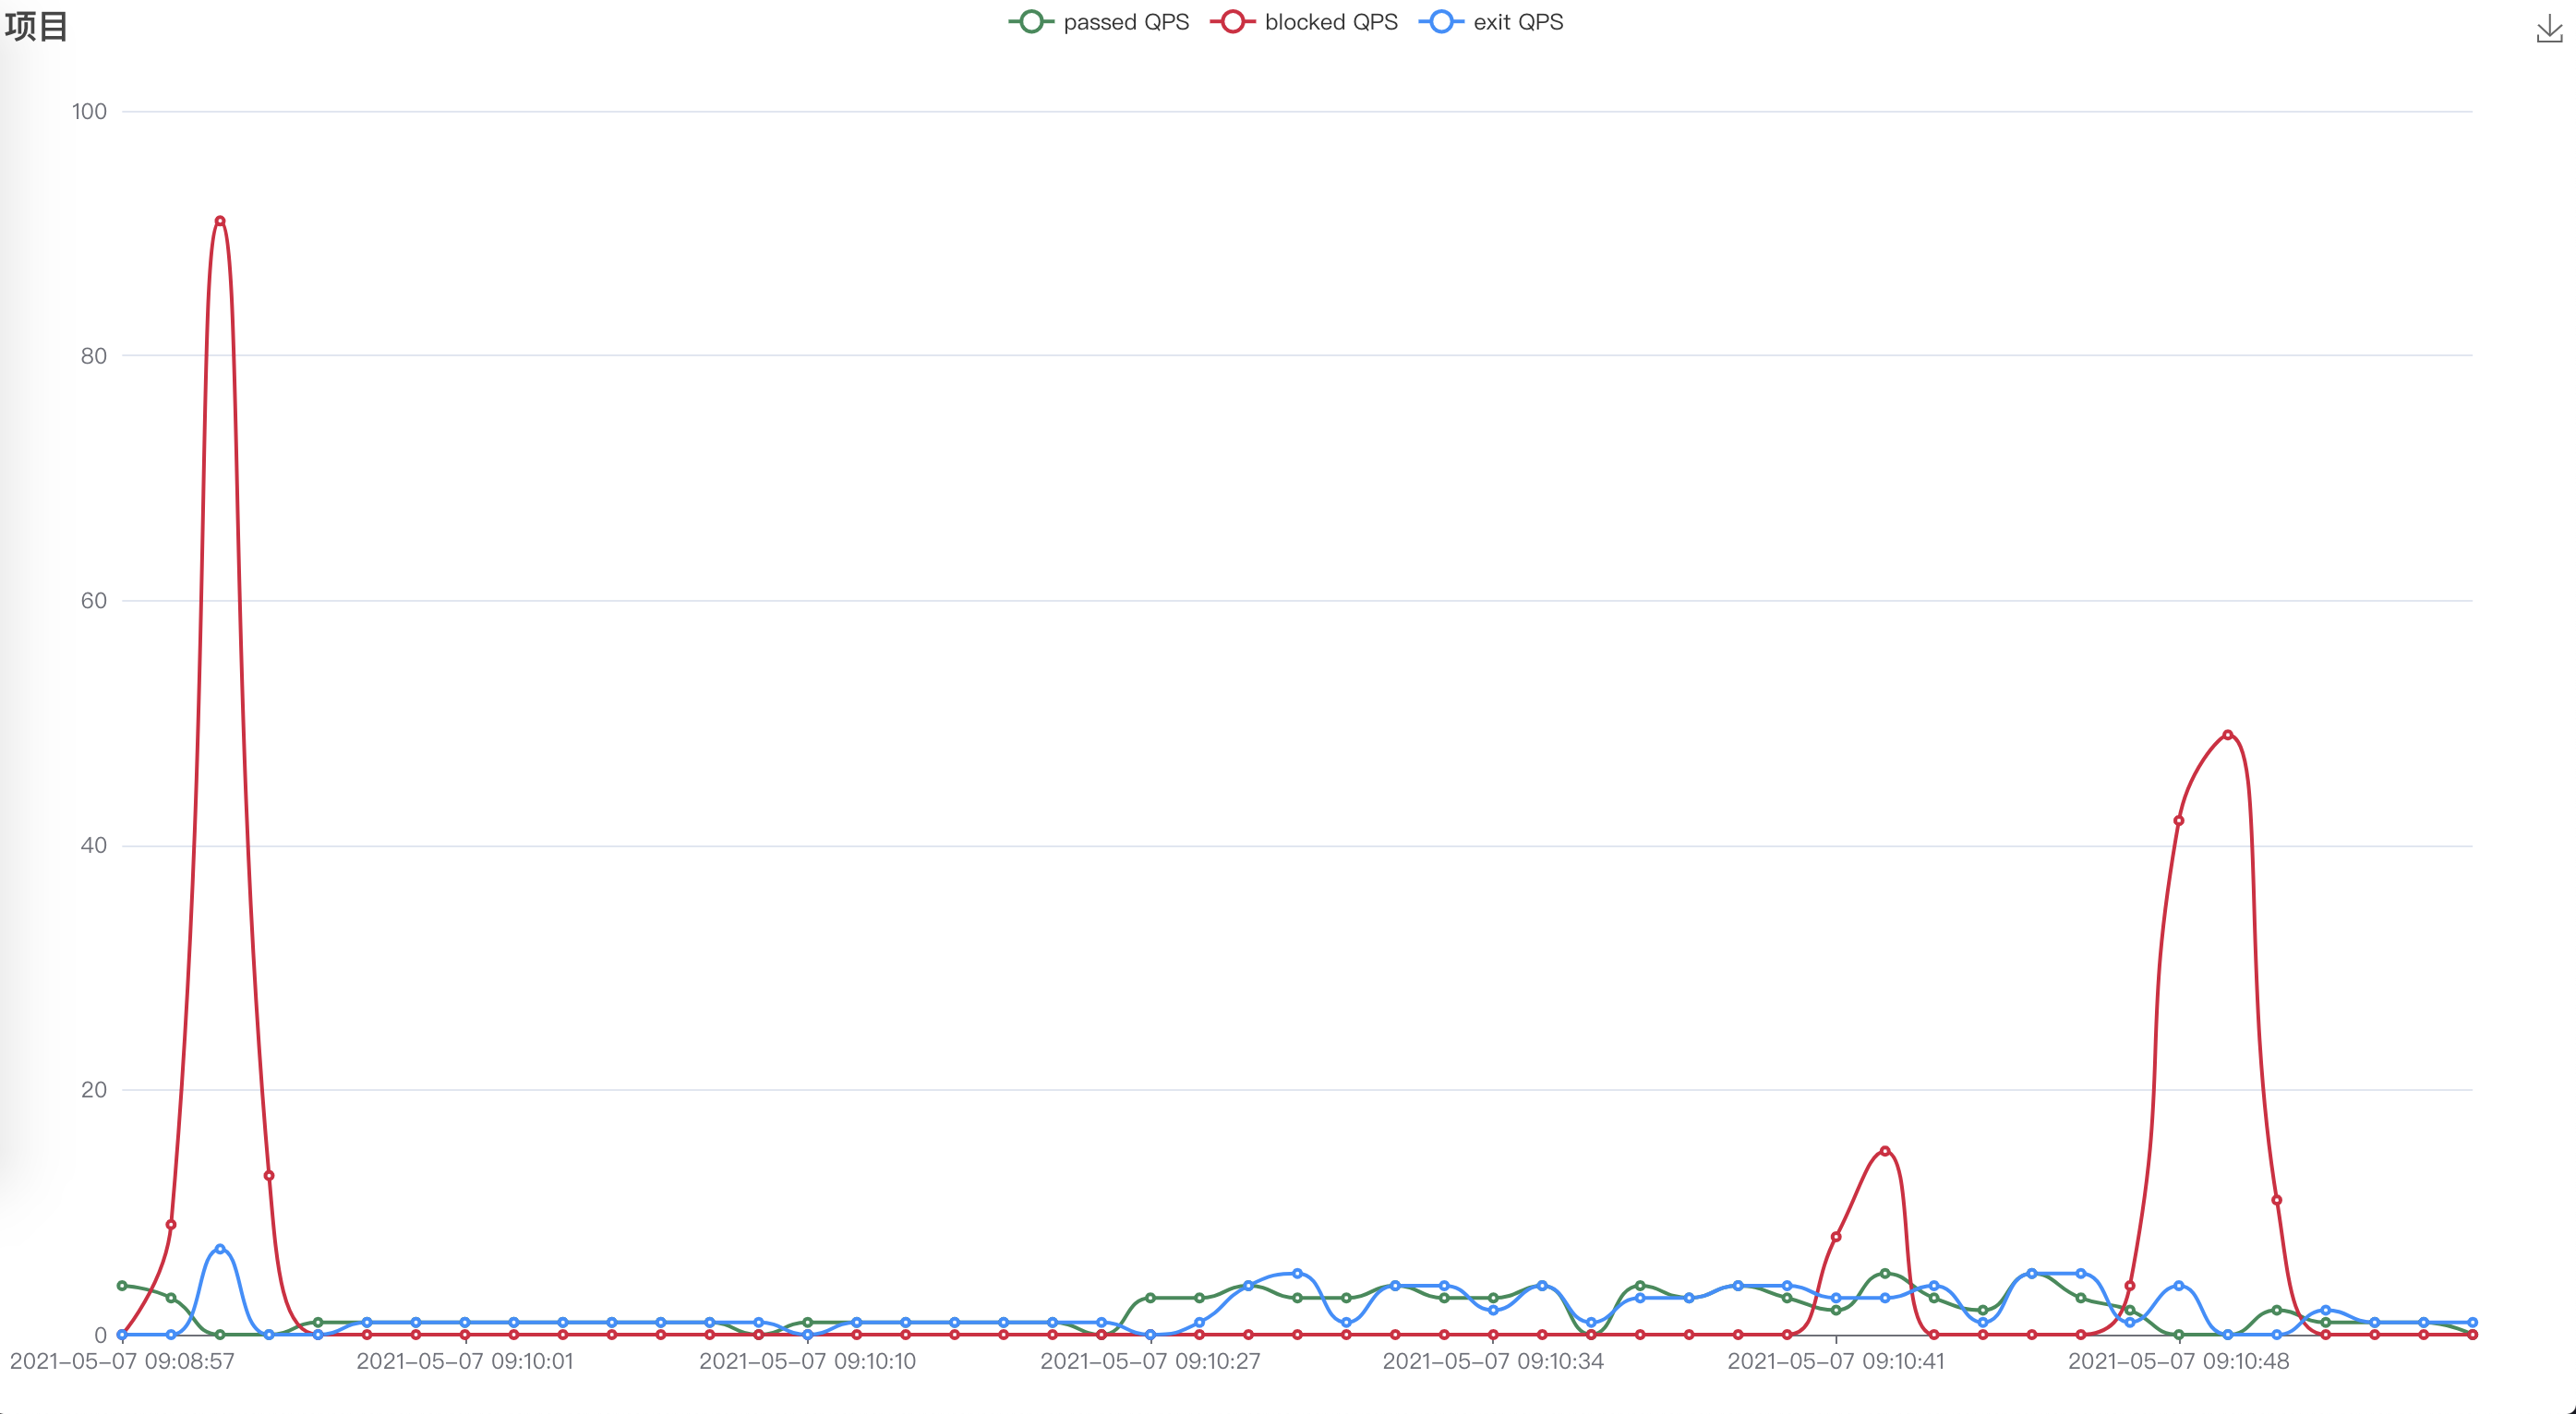
text: '项目'
},
tooltip: {
trigger: 'axis'
},
legend: {
data: ['passed QPS', 'blocked QPS', 'exit QPS']
},
grid: {
left: '3%',
right: '4%',
bottom: '3%',
containLabel: true
},
toolbox: {
feature: {
saveAsImage: {}
}
},
xAxis: {
type: 'category',
boundaryGap: false,
data: ["''' + '","'.join(time_line) + '''"]
},
yAxis: {
type: 'value'
},
series: [
{
name: 'passed QPS',
type: 'line',
smooth: true,
stack: 'passed QPS',
data: ["''' + '","'.join(pass_qps_line) + '''"]
},
{
name: 'blocked QPS',
type: 'line',
smooth: true,
stack: 'blocked QPS',
data: ["''' + '","'.join(blocked_qps_line) + '''"]
},
{
name: 'exit QPS',
type: 'line',
smooth: true,
stack: 'exit QPS',
data: ["''' + '","'.join(exit_qps_line) + '''"]
}
]
};
if (option && typeof option === 'object') {
myChart.setOption(option);
}
</script>
</body>
</html>
'''
file_name = str.replace(file_name, '/', '_')
fo = open(file_name + ".html", 'w')
fo.write(content)
fo.close()
if __name__ == '__main__':
printSentinel()