一、背景:
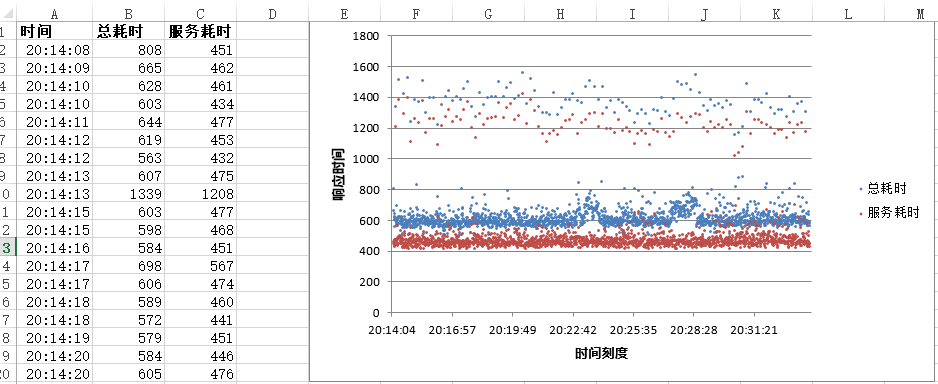
为了统计服务器在不同并发请求数下响应的处理速度,对每一个请求的耗时进行了记录,后面将每个请求通过散点图表示出来,查看响应的分布状态。
txt文档格式,读取到excel后的展示。


二、流程解析
1.读取文件函数
使用f.readlines() 按行读取,最终返回一个列表,每行内容为一个列表中的元素。
2.最小和最大函数
因为excel中图表x轴需要一个浮点数,在excel中1:00:00 时间格式转换为数值为0.04147,所以首先取时间里面最小和最大的时间转换为浮点数为后面图表的范围做准备。
3. 画图函数
使用xlsxwriter只能创建,不能读取和修改文件。
首先使用worksheet.write方法写入原始数据,再通过workbook.add_chart方法添加图表。
三、xlsxwriter使用方法
列宽度设置 worksheet.set_column('A:A', 20)
单元格样式设置
bold=workbook.add_format({'bold':True})
worksheet.write('A1',headings[0],bold)
写数据方法(默认write写入为文本)
worksheet.write('A1',headings[0],bold)
worksheet.write_datetime(row,col,date_time,time_formats)
worksheet.write_number(row,col+1,int(content_line[1]))
图表系列设置
chart.add_series({
    'name':['服务耗时统计',0,1],
    'categories':['服务耗时统计',1,0,row,0],
    'values':['服务耗时统计',1,1,row,1],
    'marker': {'type': 'circle',
               'size':2},
})
图表xy轴设置
chart.set_x_axis({
    'name':'时间刻度',
    'min':f_min,
    'max':f_max,


})
chart.set_y_axis({
    'name':'响应时间(ms)',
})
四、代码
import xlsxwriter
import datetime
# 数据读取
def read_txt():
    content=[]
    with open('./cptn1','r') as f:
        content_line=f.readlines()
    for content_row in content_line:
        content.append(content_row.strip('
').split(','))

    return content
def min_max(content):
    # min=content[0][0].split(' ')
    # max=content[-1][0].split(' ')
    min=content[0][0].split(':')
    max=content[-1][0].split(':')
    print(min,max)
    result_min=list(map(int,min))
    result_max=list(map(int,max))
    hour = 0.04167
    minute=0.0007
    f_min=round(result_min[0]*hour+minute*result_min[1]-0.0001,5)
    f_max=round(result_max[0]*hour+minute*result_max[1]+0.0005,5)
    print(f_min,f_max)
    return f_min,f_max
def writetoexcel(f_min,f_max):
    content=read_txt()
    # print(content)
    workbook=xlsxwriter.Workbook('point_chart.xlsx')
    worksheet=workbook.add_worksheet('服务耗时统计')
    worksheet.set_column('A:A', 20)

    headings=['时间','总耗时','服务耗时']
    # 粗体形式
    bold=workbook.add_format({'bold':True})
    time_formats=workbook.add_format({'num_format':'hh:mm:ss'})
    # 首行标题添加
    worksheet.write('A1',headings[0],bold)
    worksheet.write('B1',headings[1],bold)
    worksheet.write('C1',headings[2],bold)

    # 内容
    col=0
    row=1
    for content_line in content:
        # 时间
        date_time=datetime.datetime.strptime(content_line[0],'%H:%M:%S')

        worksheet.write_datetime(row,col,date_time,time_formats)
        # 总耗时
        worksheet.write_number(row,col+1,int(content_line[1]))
        # 服务耗时
        worksheet.write_number(row,col+2,int(content_line[2]))
        row+=1

    # 图表添加
    chart=workbook.add_chart({'type':'scatter'})
    # straight_with_markers
    # straight
    # smooth_with_markers
    # smooth
    chart.set_size({'width':700,
                    'height':500})
    chart.add_series({
        'name':['服务耗时统计',0,1],
        'categories':['服务耗时统计',1,0,row,0],
        'values':['服务耗时统计',1,1,row,1],
        'marker': {'type': 'circle',
                   'size':2},
    })
    chart.add_series({
        'name': ['服务耗时统计', 0, 2],
        'categories':['服务耗时统计',1,0,row,0],
        'values':['服务耗时统计',1,2,row,2],
        'marker': {'type': 'circle',
                   'size':2},
    })
    chart.set_x_axis({
        'name':'时间刻度',
        'min':f_min,
        'max':f_max,


    })
    chart.set_y_axis({
        'name':'响应时间(ms)',
    })
    worksheet.insert_chart('F1',chart)
    workbook.close()
    print('done')
if __name__=='__main__':
    content=read_txt()
    min,max=min_max(content)
    writetoexcel(min,max)
最终效果图:
