一、图例
二、学习记录
1、版本对应:echarts-liquidfill@2对应echarts@4;echarts-liquidfill@3对应echarts@5。
2、echarts-liquidfill的安装:npm install echarts-liquidFill@2。(echarts用的4的版本)
3、echarts-liquidfill的引用:require('echarts-liquidFill');
4、饼图中使用的圆角无效,原因暂不明:itemStyle.borderRadius。(???)
三、示例
import * as echarts from 'echarts';
require('echarts-liquidFill');
let ua = function _fun(k) {
return function (a,b) {
return b[k] - a[k];
}
}
let colors = ['#5470c6', '#91cc75', '#fac858', '#ee6666', '#73c0de', '#3ba272', '#fc8452', '#9a60b4', '#ea7ccc'];
let datum = [
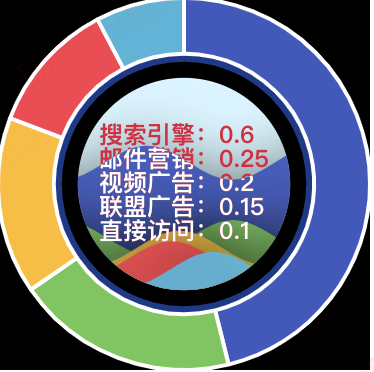
{value: 600, name: '搜索引擎'},
{value: 100, name: '直接访问'},
{value: 250, name: '邮件营销'},
{value: 150, name: '联盟广告'},
{value: 200, name: '视频广告'}
];
let llDatum = datum.sort(ua('value'));
llDatum.forEach((item, index)=>{
item.value = item.value / 1000;
item['itemStyle'] = {};
item['itemStyle']['color'] = colors[index];
});
let option = {
grid:{
top: 0,
left: 0,
right: 0,
bottom: 0,
containLabel: true
},
tooltip: {
trigger: 'item'
},
series: [
{
name: '访问来源',
type: 'pie',
radius: ['70%', '100%'],
avoidLabelOverlap: false,
itemStyle: {
borderRadius: 10, //此处无效???
borderColor: '#fff',
borderWidth: 2
},
label: {
show: false,
position: 'center'
},
emphasis: {
label: {
show: false,
fontSize: '40',
fontWeight: 'bold'
}
},
labelLine: {
show: false
},
data: datum.sort(ua('value'))
},
{
type: 'liquidFill',
shape: 'circle',
radius: '70%',
phase: 0,
period: 'auto',
color: ['#294D99', '#ff0000', '#1598ED', '#45BDFF'],
label: {
position: ['10%', '55%'],
align: 'left',
baseline: 'middle',
formatter: function(params) {
console.log('value',params);
let str = ''
llDatum.forEach((item, index) => {
str += item.name + ':' + item.value +'
';
})
return str;
},
fontSize: 12,
color: '#D94854'
},
data: llDatum
}]
};
let myChart = echarts.init(document.getElementById('canvasBox'));
myChart.setOption(option);
window.addEventListener("resize", myChart.resize);
四、Liquid Fill Chart API
data: [], // 数值建议从大到小排序,否则小的会被大的遮挡以致看不到某层;【类型:小数或百分比】
color: ['#294D99', '#156ACF', '#1598ED', '#45BDFF'],
center: ['50%', '50%'],
radius: '50%',
amplitude: '8%',
waveLength: '80%',
phase: 'auto',
period: 'auto',   //  {number|'auto'|function(value,index)} 定义波浪速度
direction: 'right', // 定义波浪移动方向
shape: 'circle',  //`'circle'`, `'rect'`, `'roundRect'`, `'triangle'`, `'diamond'`, `'pin'`, `'arrow'`;

waveAnimation: true,
animationEasing: 'linear',
animationEasingUpdate: 'linear',
animationDuration: 2000,
animationDurationUpdate: 1000,

outline: {
    show: true,
    borderDistance: 8,
    itemStyle: {
        color: 'none',
        borderColor: '#294D99',
        borderWidth: 8,
        shadowBlur: 20,
        shadowColor: 'rgba(0, 0, 0, 0.25)'
    }
},

backgroundStyle: {
    color: '#E3F7FF'
},

itemStyle: {
    opacity: 0.95,
    shadowBlur: 50,
    shadowColor: 'rgba(0, 0, 0, 0.4)'
},

label: {
    show: true,
    color: '#294D99',
    insideColor: '#fff',
    fontSize: 50,
    fontWeight: 'bold',

    align: 'center',
    baseline: 'middle',
    position: 'inside'
},

emphasis: {
    itemStyle: {
        opacity: 0.8
    }
}
}