zoukankan      html  css  js  c++  java
  • 数据嵌入js的关系图

    参照echarts官网,改了一下效果图:
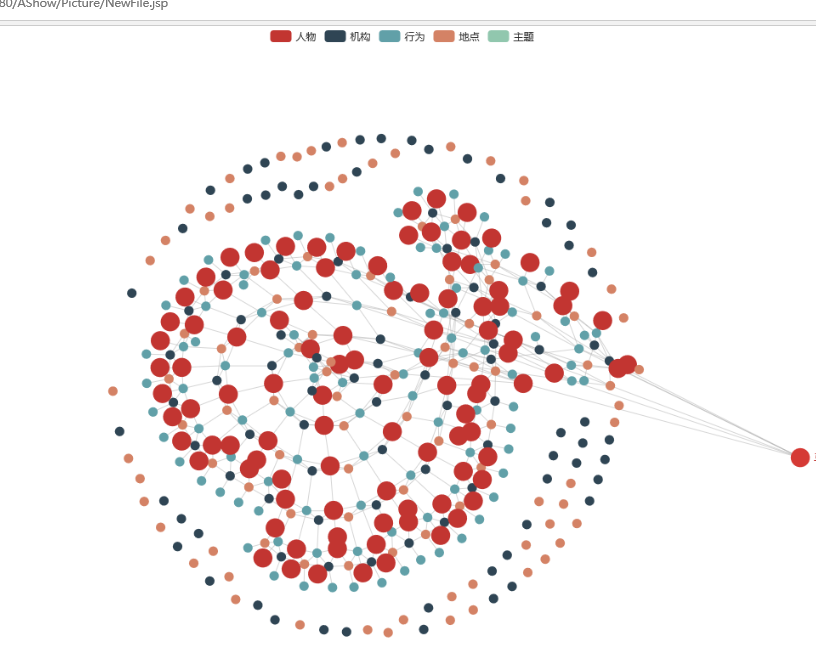
    数据放在了js里。

    代码:

    <%@ page language="java" contentType="text/html; charset=utf-8"
        pageEncoding="utf-8"%>
    <!DOCTYPE html>
    <html style="height: 100%">
       <head>
           <meta charset="utf-8">
       </head>
       <body style="height: 100%; margin: 0">
           <div id="container" style="height: 100%"></div>
              <script type="text/javascript" src="http://code.jquery.com/jquery-1.11.0.min.js"></script>
             <script src="echarts.min.js"></script>
            <script src="dataTool.js"></script>      
           <script type="text/javascript">
    var dom = document.getElementById("container");
    var myChart = echarts.init(dom);
    var app = {};
    option = null;
    myChart.hideLoading();
            categories=[
                {
                    "name": "人物",
                    "keyword": {},
                    "base": "HTMLElement"
                },
                {
                    "name": "机构",
                    "keyword": {},
                    "base": "WebGLRenderingContext"
                },
                {
                    "name": "行为",
                    "keyword": {},
                    "base": "SVGElement"
                },
                {
                    "name": "地点",
                    "keyword": {},
                    "base": "CSSRule"
                },
                {
                    "name": "主题",
                    "keyword": {}
                }
            ],
            nodes=[
                <%for(int i=0;i<100;i++){%>
                {
                    name: "马<%=i%>",
                    value: 100,
                    category: 0,
                    symbolSize:20,
                },
                {
                    name: "刘<%=i%>",
                   value: 1,
                    category: 1
                },
                {
                    name: "是<%=i%>",
                    value: 1,
                    category: 2,
                },
                {
                    name: "我<%=i%>",
                    value: 1,
                    category:3
                },
                <%}%>
            ],
    links=[
        <%for(int i=1;i<200;i++){%>
        {
            source: <%=i%>,
            target: <%=i+1%>
        },
        {
            source:<%=i%>,
            target: <%=i*2%>
        },
        {
            source:<%=i+1%>,
            target: <%=i-1%>
        },
        <%}%>
    ],
        option = {
                /*     color: ['#fc853e','#28cad8','#9564bf','#bd407e','#e5a214'], 用来改点的颜色*/        
            legend: {
                data: ['人物', '机构', '行为', '地点', '主题']
            },
            series: [{
                type: 'graph',
                layout: 'force',
                roam: true,    //实现缩放
                animation: false,
                label: {
                    normal: {
                        position: 'right',
                        formatter: '{b}'
                    }
                },
                draggable: true,
                data: nodes.map(function (node, idx) {
                    node.id = idx;
                    return node;
                }),
                categories: categories,
                force: {
                    // initLayout: 'circular'
                    // repulsion: 20,
                    edgeLength: 5,
                    repulsion: 20,
                    gravity: 0.2
                },
                edges: links
            }]
        };
    
        myChart.setOption(option);
        myChart.on('click', function (params) {
            var data=params.value
            //点没有source属性
            if(data.source==undefined){
                nodeName=params.name
                window.open("NewFile1.jsp?a=mjh")
            }
    
    });
    if (option && typeof option === "object") {
        myChart.setOption(option, true);
    }
    
           </script>
       </body>
    </html>
  • 相关阅读:
    matplotlib数据可视化之柱形图
    xpath排坑记
    Leetcode 100. 相同的树
    Leetcode 173. 二叉搜索树迭代器
    Leetcode 199. 二叉树的右视图
    Leetcode 102. 二叉树的层次遍历
    Leetcode 96. 不同的二叉搜索树
    Leetcode 700. 二叉搜索树中的搜索
    Leetcode 2. Add Two Numbers
    Leetcode 235. Lowest Common Ancestor of a Binary Search Tree
  • 原文地址:https://www.cnblogs.com/mm20/p/11978938.html
Copyright © 2011-2022 走看看