【问题】
想要折腾Python中的Excel中的图标,Chart,Graph。
【解决过程】
1.参考:
use python to generate graph in excel
说是可以用pywin32的OLE automation
去试试其代码:
结果出错:
|
D: mp mp_dev_rootpythonexcel_chart>excel_chart.py File "D: mp mp_dev_rootpythonexcel_chartexcel_chart.py", line 13, in <module> from win32com.client import Dispatch; ImportError: No module named win32com.client |
2.关于上述错误的折腾过程,参见:很明显,是没有对应的库。
【已解决】Python中出错:ImportError: No module named win32com.client
3.再参考:
Creating Charts in Excel with pyExcelerator.ExcelMagic
去写代码,结果又出现了错误,详细折腾过程见:
4.最后,最终结果是,
在当前文件夹下面,建立一个空的xsl文件:chart_demo.xls
然后用下面的代码:
#!/usr/bin/python
# -*- coding: utf-8 -*-
"""
Function:
【已解决】Python中处理操作Excel中的图表(Chart,Graph)
http://www.crifan.com/python_process_excel_chart_graph

Author:     Crifan Li
Version:    2012-12-25
Contact:    admin at crifan dot com
"""

import os;
from win32com.client import Dispatch;
#from win32com.client import *;

def excelChart():
    xl = Dispatch("Excel.Application");
    #xl = win32com.client.Dispatch("Excel.Application")
    print "xl=",xl;

    #[1] Fail
    # xlsPath = "chart_demo.xls";
    # wb = xl.Workbooks.open(xlsPath); #pywintypes.com_error

    #[2] Fail
    # xlsPath = "D:	mp	mp_dev_rootpythonexcel_chartchart_demo.xls";
    # absPath = os.path.abspath(xlsPath);
    # print "absPath=",absPath; #absPath= D:	mp	mp_dev_rootpythonexcel_chart        mp      mp_dev_rootpythonexcel_chartchart_demo.xls
    # wb = xl.Workbooks.open(absPath); #pywintypes.com_error

    #[3] Fail
    # xlsPath = "D:	mp	mp_dev_rootpythonexcel_chartchart_demo.xls";
    # normalPath = os.path.normpath(xlsPath);
    # print "normalPath=",normalPath; #normalPath= D:  mp      mp_dev_rootpythonexcel_chartchart_demo.xls
    # wb = xl.Workbooks.open(normalPath); #pywintypes.com_error

    #[4] Fail
    # rawPath = r"chart_demo.xls";
    # wb = xl.Workbooks.open(rawPath); #pywintypes.com_error

    #[5] OK
    xlsPath = "chart_demo.xls";
    absPath = os.path.abspath(xlsPath);
    print "absPath=",absPath; #absPath= D:	mp	mp_dev_rootpythonexcel_chartchart_demo.xls
    wb = xl.Workbooks.open(absPath); #OK

    #[6] OK
    # rawPath = r"D:	mp	mp_dev_rootpythonexcel_chartchart_demo.xls";
    # wb = xl.Workbooks.open(rawPath); # OK


    xl.Visible = 1;
    ws = wb.Worksheets(1);
    ws.Range('$A1:$D1').Value = ['NAME', 'PLACE', 'RANK', 'PRICE'];
    ws.Range('$A2:$D2').Value = ['Foo', 'Fooland', 1, 100];
    ws.Range('$A3:$D3').Value = ['Bar', 'Barland', 2, 75];
    ws.Range('$A4:$D4').Value = ['Stuff', 'Stuffland', 3, 50];
    wb.Save();
    wb.Charts.Add();
    wc1 = wb.Charts(1);

if __name__ == "__main__":
    excelChart();
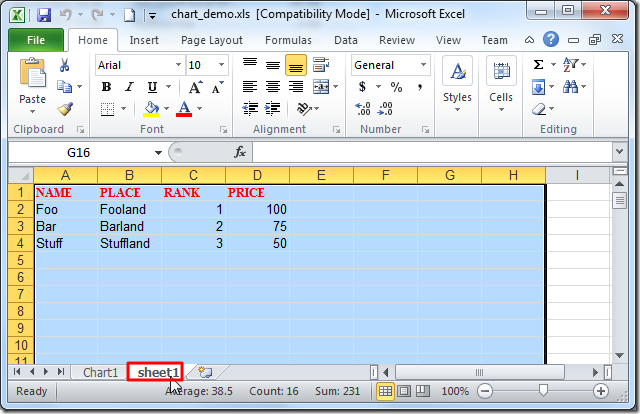
写入的excel中的内容是:
生成的图表的效果是:
【总结】
总的来说,使用win32com.client,去操作excel文件,效果还是不错的。

