效果图

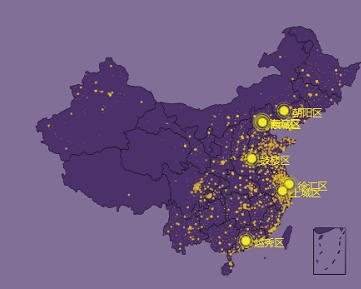
显示效果和echarts官方demo一样,运行速度尚可。
第一次写博客,排版很渣以后慢慢改进。
基础知识
以EchartsGeoMap为例,讲一下怎么制作一个基础的QlikView Extensions。
1.前置技能: 基础dom知识, 基础js知识。能做官方下载的demo到能够在本地运行。能看懂并理解下面的代码就可以了。
<html>
<head>
    <script src="./lib/js/jquery.min.js"></script>
    <script src="./lib/js/echarts.js"></script>
    <script type="text/javascript">
        $(function () {
            var myChart = echarts.init(document.getElementById('container'));
            myChart.showLoading();
            $.get('./lib/maps/HK_geo.json', function (geoJson) {
                myChart.hideLoading();
                echarts.registerMap('HK', geoJson);
                myChart.setOption(option = {
                    tooltip: {
                        trigger: 'item',
                        formatter: '{b}<br/>{c} (p / km2)'
                    },
                    toolbox: {
                        show: true,
                        left: 'left',
                        top: 'top',
                        feature: {
                            dataView: { readOnly: false },
                            restore: {},
                            saveAsImage: {}
                        }
                    },
                    visualMap: {
                        min: 800,
                        max: 50000,
                        text: ['High', 'Low'],
                        realtime: false,
                        calculable: true,
                        inRange: {
                            color: ['lightskyblue', 'yellow', 'orangered']
                        }
                    },
                    series: [
                        {
                            name: '香港18区人口密度',
                            type: 'map',
                            mapType: 'HK', // 自定义扩展图表类型
                            selectedMode: 'multiple',
                            itemStyle: {
                                normal: { label: { show: true } },
                                emphasis: { label: { show: true } }
                            },
                            data: [
                                { name: '中西区', value: 20057.34 },
                                { name: '湾仔', value: 15477.48 },
                                { name: '东区', value: 31686.1 },
                                { name: '南区', value: 6992.6 },
                                { name: '油尖旺', value: 44045.49 },
                                { name: '深水埗', value: 40689.64 },
                                { name: '九龙城', value: 37659.78 },
                                { name: '黄大仙', value: 45180.97 },
                                { name: '观塘', value: 55204.26 },
                                { name: '葵青', value: 21900.9 },
                                { name: '荃湾', value: 4918.26 },
                                { name: '屯门', value: 5881.84 },
                                { name: '元朗', value: 4178.01 },
                                { name: '北区', value: 2227.92 },
                                { name: '大埔', value: 2180.98 },
                                { name: '沙田', value: 9172.94 },
                                { name: '西贡', value: 3368 },
                                { name: '离岛', value: 806.98 }
                            ],
                            // 自定义名称映射 date→nameMap→geoJson
                            nameMap: {
                                'Central and Western': '中西区',
                                'Eastern': '东区',
                                'Islands': '离岛',
                                'Kowloon City': '九龙城',
                                'Kwai Tsing': '葵青',
                                'Kwun Tong': '观塘',
                                'North': '北区',
                                'Sai Kung': '西贡',
                                'Sha Tin': '沙田',
                                'Sham Shui Po': '深水埗',
                                'Southern': '南区',
                                'Tai Po': '大埔',
                                'Tsuen Wan': '荃湾',
                                'Tuen Mun': '屯门',
                                'Wan Chai': '湾仔',
                                'Wong Tai Sin': '黄大仙',
                                'Yau Tsim Mong': '油尖旺',
                                'Yuen Long': '元朗'
                            }
                        }
                    ]
                });
            });
            myChart.on('click', function (params) {
                alert(params.seriesName);
                alert(params.name);
                alert(params.value);
            });
        })
    </script>
</head>

<body>
    <div id="container" style=" 600px; height: 600px; margin: 0 auto"></div>
</body>

</html>
2.QlikView Extensions基础知识
目录结构
lib/js //引用的js文件 ( jquery3,echarts3 )
lib/maps //地图数据 ( 省份地图数据来自dataV.js项目 )
Definition.xml //qv中右键配置;文件名不能改
Icon.png //插件图标;文件名不能改
Script.js //自定义脚本;文件名不能改
1.以上文件最后要打包在qar中,以后在用户机器上安装。目前还没找到官方的方法,我是用winrar打开官方的qar包,把文件替换掉。
2.webview模式会使用ie浏览器内核。
开始
1.Definition.xml
<?xml version="1.0" encoding="gb2312"?>
<ExtensionObject Path="EChartsGeoMap"     //插件路径
                 Label="EChartsGeoMap"     //插件名称
                 Description="EChartsGeoMap"  //插件描述
                 Type="object">
    <Dimension Label="Dimension" Initial=""/>     //维度
    <Measurement Label="Expression" Initial="" />  //表达式
  <!--设置参数;Expression="" 设置默认值-->
    <Text Label="MapFile" Type="text" Initial="" Expression="china"/>
    <Text Label="Color(L;N;U)" Type="text" Initial="" Expression="lightskyblue;yellow;orangered"/>
    <Text Label="Color Piecewise" Type="text" Expression="0"/>
    <Text Label="Color Piecewise(L;U)" Type="text" Initial="" Expression="80;100"/>
</ExtensionObject>
DynProperties.qvpp会在启动qv时根据以上xml自动生成。
2.Script.js
/*! echartsGeoMap v1.0 | MyronJi |  */
function EChartsGeoMap_Init() {
    if (document.charset) {
        document.charset = 'utf-8';     //更改页面编码
    }
    Qva.AddExtension("EChartsGeoMap", function () {     //注册插件,这里的名字要和xml中的name相同
        var _this = this;

        _this.ExtSettings = {};
        _this.ExtSettings.ExtensionName = 'EChartsGeoMap';
        _this.ExtSettings.LoadUrl = Qva.Remote + (Qva.Remote.indexOf('?') >= 0 ? '&' : '?') + 'public=only' + '&name=';     //获取插件目录路径

        var mapPath = 'Extensions/' + _this.ExtSettings.ExtensionName + '/lib/maps';
        var imagePath = 'Extensions/' + _this.ExtSettings.ExtensionName + '/lib/images';

        //Array to hold the js libraries to load up.
        var jsFiles = [];

        //pushing the js files to the jsFiles array
        jsFiles.push('Extensions/' + _this.ExtSettings.ExtensionName + '/lib/js/jquery.min.js');
        jsFiles.push('Extensions/' + _this.ExtSettings.ExtensionName + '/lib/js/echarts.min.js');

        //get qv value
        var mapData = [];
        var maxValue = 0;
        var minValue = 50;
        var colorParameter = [];

        try {
            d = _this.Data      //_this.Data.Rows[i][j].text,这是获取xml中维度和表达式的方法。
            for (var i = 0; i < d.Rows.length; i++) {
                var r = d.Rows[i];

                obj = {
                    name: r[0].text,
                    value: parseFloat(r[1].text)
                };
                if (maxValue < obj.value) { maxValue = obj.value };
                if (minValue > obj.value) { minValue = obj.value };
                mapData.push(obj);
            }

            var mapFile = _this.Layout.Text0.text.toString();       //这是获取xml中设置参数的方法。
            var colors = _this.Layout.Text1.text.split(';');
            var colorType = _this.Layout.Text2.text.toString();
            var Piecewise_Lower = parseFloat(_this.Layout.Text3.text.split(';')[0]);
            var Piecewise_Upper = parseFloat(_this.Layout.Text3.text.split(';')[1]);


            //set default value
            if ('' == maxValue) maxValue = 100;
            if ('' == minValue) minValue = 0;
            if ('' == colors) colors = ['lightskyblue', 'yellow', 'orangered'];
            if ('' == colorType) colorType = 0;

            //set colorParameter
            if (colorType == 0) {
                colorParameter = {
                    type: 'continuous',
                    min: minValue,
                    max: maxValue,
                    text: ['High', 'Low'],
                    realtime: false,
                    calculable: true,
                    inRange: {
                        color: colors,//['lightskyblue','yellow', 'orangered'],
                        symbolSize: [30, 100]
                    }
                }
            }
            else {
                colorParameter = {
                    type: 'piecewise',
                    pieces: [
                        { min: Piecewise_Upper, color: colors[2] },
                        { min: Piecewise_Lower, max: Piecewise_Upper, color: colors[1] },
                        { max: Piecewise_Lower, color: colors[0] }
                    ],
                    left: 'left',
                    top: 'bottom'
                }
            }
            //Loading up the js files via the QlikView api that allows an array to be passed.
            //After we load them up successfully, initialize the chart settings and append the chart
            Qv.LoadExtensionScripts(jsFiles, function () {      //载入jsFiles array中的文件
                InitSettings();
                Init();
                if ('' != mapFile) {        //空值判断,以免报错

                    InitChart(mapFile, mapData, maxValue, minValue);
                } else {
                    $(mapchart).html('<div id="errormsg">There was an issue creating the map. Did you forget to set the MapFile?</div> ');
                }

            });
        }
        catch (err) {
            $(mapchart).html('<div id="errormsg">There was an issue creating the map. Did you forget to set the Extensions?</div> ');
        }

        function InitSettings() {

            _this.ExtSettings.UniqueId = _this.Layout.ObjectId.replace('\', '_');      //获取qv对象id

        }

        function Init() {

            $(_this.Element).empty();

            mapchart = document.createElement("div");       //创建地图容器
            $(mapchart).attr('id', 'Chart_' + _this.ExtSettings.UniqueId);
            $(mapchart).height('100%');
            $(mapchart).width('100%');
            $(_this.Element).append(mapchart);
        }

        function InitChart(mapFile, mapData, maxValue, minValue) {
            try {
                var myChart = echarts.init(document.getElementById('Chart_' + _this.ExtSettings.UniqueId));

                myChart.showLoading();
                $.ajaxSetup({
                    async: false
                });
                $.get(_this.ExtSettings.LoadUrl + 'Extensions/EChartsGeoMap/lib/maps/' + mapFile + '.json').done(function (geoJson) {
                    myChart.hideLoading();
                    echarts.registerMap(mapFile, geoJson);
                    option = {
                        tooltip: {
                            trigger: 'item'
                        },
                        toolbox: {
                            show: true,
                            left: 'left',
                            top: 'top',
                            feature: {
                                dataView: { readOnly: false }
                            }
                        },
                        visualMap: colorParameter,
                        series: [
                            {
                                name: 'data',
                                type: 'map',
                                mapType: mapFile,
                                selectedMode: 'multiple',
                                itemStyle: {
                                    normal: { label: { show: true } },
                                    emphasis: { label: { show: true } }
                                },
                                data: mapData
                            }
                        ]
                    };

                    myChart.setOption(option);
                });
                //ckick
                myChart.on('click', function (params) {
                    _this.Data.SelectRow(params.dataIndex);     //单击地图会选中当前维度中值。
                });
            }
            catch (err) {
                if (typeof map != 'undefined') {
                    map.remove();
                }
                $(mapchart).html('<div id="errormsg">There was an issue creating the map. Did you forget to set the Expressions?<br/><br/><b>Error Message:</b><br />' + err.message + '</div> ');

            }
        }
    });
};


EChartsGeoMap_Init();
qv向插件传值的时候会把维度和表达式的值组合成一个数组传到js中。
this.Data.Rows对应xml中的维度和表达式。[i][j].text,i代表行号,j 代表列号。
设置值会打包成另一个数组传进来。
_this.Layout.Text0.text.toString()中的Text0对应xml中的 <Text Label="MapFile" Type="text" Initial="" Expression="china"/>
源代码
最后附上github地址: