Tencent Cloud Monitor App
Grafana 是一个开源的时序性统计和监控平台,支持例如 elasticsearch、graphite、influxdb 等众多的数据源,并以功能强大的界面编辑器著称,允许您对指标进行查询、可视化展示、设置告警等操作,以及自定义配置仪表盘。
Grafana 已经拥有一个强大的贡献者和插件开发者社区。开发者社区提供了三种类型的插件:
- Panel Plugin: 针对图形展示的面板插件;
- Datasource Plugin: 针对数据源的插件;
- App Plugin: 针对完整应用的插件,通常由 Panel Plugin,Datasource Plugin 以及 Dashboards 模板组成;
Tencent Cloud Monitor App 的目录结构
本文主要介绍的是 App Plugin 的开发过程以及相关的代码组织。基于腾讯云云监控 API 的 Tencent Cloud Monitor App 插件(TencentCloud/tencentcloud-monitor-grafana-app),主要由两部分组成: Datasource Plugin 和 Dashboards 模板组成,代码的目录结构如下:
.
├── CHANGELOG.md
├── LICENSE
├── README.md
├── dist // 文件夹,文件夹 src 打包后的代码
├── package.json
├── src
│ ├── components
│ │ ├── config.html
│ │ └── config.ts
│ ├── dashboards // Dashboards 典型模板存放
│ │ ├── example_cdb_dashboard.json
│ │ └── example_cvm_dashboard.json
│ ├── datasource // Datasource Plguin 代码
│ │ ├── __mocks__
│ │ │ └── core_module.ts
│ │ ├── common
│ │ │ ├── constants.ts
│ │ │ └── sign.ts
│ │ ├── components // 自定义的 Angular 组件
│ │ │ ├── custom_select_dropdown.ts
│ │ │ └── multi_condition.ts
│ │ ├── css
│ │ │ └── query_editor.css
│ │ ├── config.ctrl.ts // ConfigCtrl 模块
│ │ ├── datasource.ts // Datasource 模块
│ │ ├── query.ctrl.ts // QueryCtrl 模块
│ │ ├── img
│ │ │ └── tencent-cloud.svg
│ │ ├── partials // Datasource Plugin 中的 html 页面
│ │ │ ├── config.html // config.ctrl.ts 对应的 html
│ │ │ ├── query.editor.html // query.ctrl.ts 对应的 html
│ │ ├── module.ts // Datasource Plguin 的 module.ts
│ │ ├── plugin.json // Datasource Plguin 的 module.ts
│ │ ├── specs // 测试用例文件夹
│ │ │ ├── tc_monitor_cdb_datasource.test.ts
│ │ │ └── tc_monitor_cvm_datasource.test.ts
│ │ └── tc_monitor // 云监控相关的产品
│ │ ├── cdb
│ │ │ ├── datasource.ts
│ │ │ ├── query.ts
│ │ │ └── query_def.ts
│ │ ├── cvm
│ │ │ ├── datasource.ts
│ │ │ ├── query.ts
│ │ │ └── query_def.ts
│ │ └── index.ts
│ ├── image // 文件夹,存放README.md 中图片
│ ├── img
│ │ └── tencent-cloud.svg
│ ├── module.ts // App Plguin 的 module.ts
│ └── plugin.json // App Plugin 的 plugion.json
├── jest.config.js // jest 框架的配置信息
├── tsconfig.jest.json
├── tsconfig.json
├── tslint.json
├── webpack.config.analyze.js
├── webpack.config.js
└── webpack.config.prod.js
在每个 Plugin 开发中存在两个重要的配置文件: plugin.json 和 module.ts。
plugin.json
plugin.json(Required): 用于描述插件的相关信息。在 Grafana 服务启动时会扫描所有的插件文件夹并挂载每个插件的 dist 目录,并查找 plugin.json 文件,根据文件的内容完成插件的自动注册。
在 Tencent Cloud Monitor App 中存在两种类型的 Plugin, 其配置文件如下: App Plugin 中配置 plugin.json:
{
"type": "app", // 插件的类型: panel | app | datasource
"name": "Tencent Cloud Monitor", // 插件名称
"id": "tencentcloud-monitor-app", // 插件ID, 必须唯一
"info": {
"description": "Tencent Cloud Monitor App for Grafana",
"author": {
"name": "Tencent Cloud"
},
"keywords": [
"tencentcloud",
"tencentcloudmonitor",
"grafana",
"plugins"
],
"logos": {
"small": "img/tencent-cloud.svg",
"large": "img/tencent-cloud.svg"
},
"version": "1.0.0",
"updated": "2019-04-10"
},
"includes": [ // App Plugin 中包含的 Datasource Plugin 和 Dashboards 模板信息
{
"type": "dashboard",
"name": "【实例】CDB 单机监控",
"path": "dashboards/example_cdb_dashboard.json"
},
{
"type": "dashboard",
"name": "【实例】CVM 单机监控",
"path": "dashboards/example_cvm_dashboard.json"
},
{
"type": "datasource",
"name": "Tencent Cloud Monitor Datasource"
}
],
"dependencies": {
"grafanaVersion": "6.0",
"plugins": []
}
}
Datasource Plugin 中配置 plugin.json:
{
"type": "datasource",
"name": "Tencent Cloud Monitor Datasource",
"id": "tencentcloud-monitor-datasource",
"metrics": true, // Datasource plugin 特有的属性,是否在 panel 中支持 metrics
"annotations": true, // Datasource plugin 特有的属性,是否在 dashboard 中支持 annotations 查询
"queryOptions": {
"maxDataPoints": true
},
"routes": [],
"info": {
"author": {
"name": "Tencent Cloud"
},
"logos": {
"small": "img/tencent-cloud.svg",
"large": "img/tencent-cloud.svg"
}
}
}
特别注意 Datasource Plugin 的 plugin.json 配置中必须存在 metric 和 annotations,且其中至少有一个属性的值为 true。
module.ts
module.ts(Required): Plugin 入口文件,决定了 Plugin 的具体实现的。根据插件的类型不同其内容也有所差异。
/* App Plugin 的 module.ts 需要导出1个模块 */
export {
ConfigCtrl,
};
/* Datasource Plugin 的 module.ts 通常需要导出5个模块 */
export {
Datasource, // Required
ConfigCtrl, // Required
QueryCtrl, // Required
AnnotationsQueryCtrl,
QueryOptionsCtrl
};
Tencent Cloud Monitor App 开发实践
基于腾讯云云监控 API —— Tencent Cloud Monitor App 完整结构图如下所示:
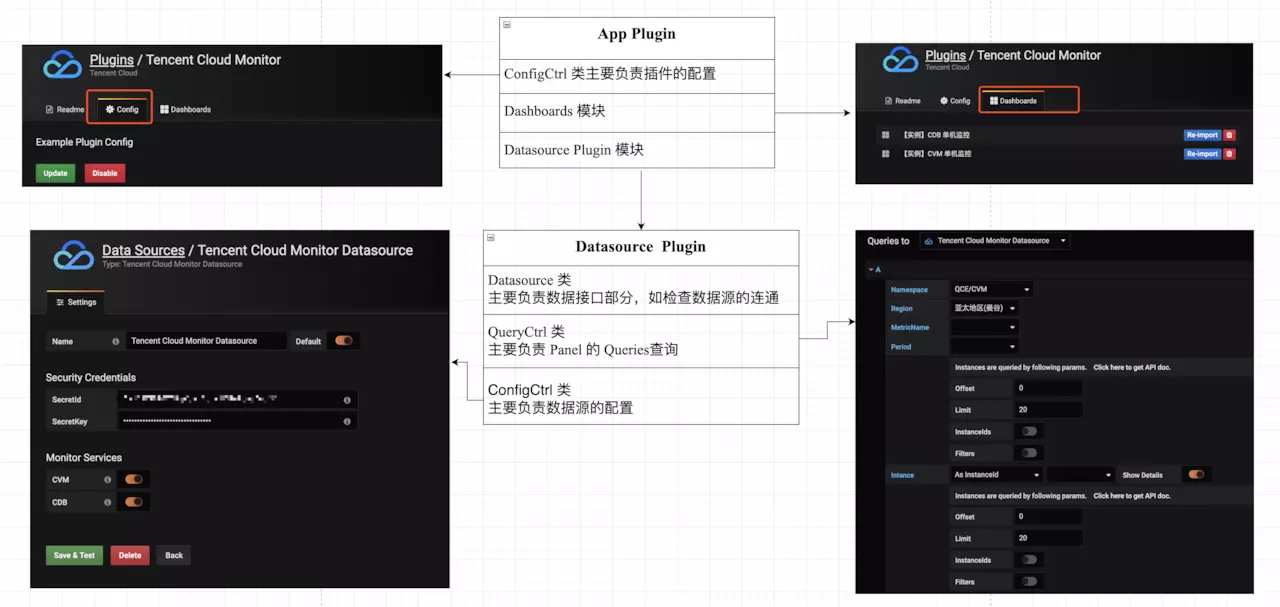
在整个应用开发中最为重要的是 Datasource Plugin 模块的开发,下面我们以该模块为例进行详细介绍。
Datasource Plugin 的开发
Datasource Plugin 中有3个必须文件:Datasource、 QueryCtrl 和 ConfigCtrl;
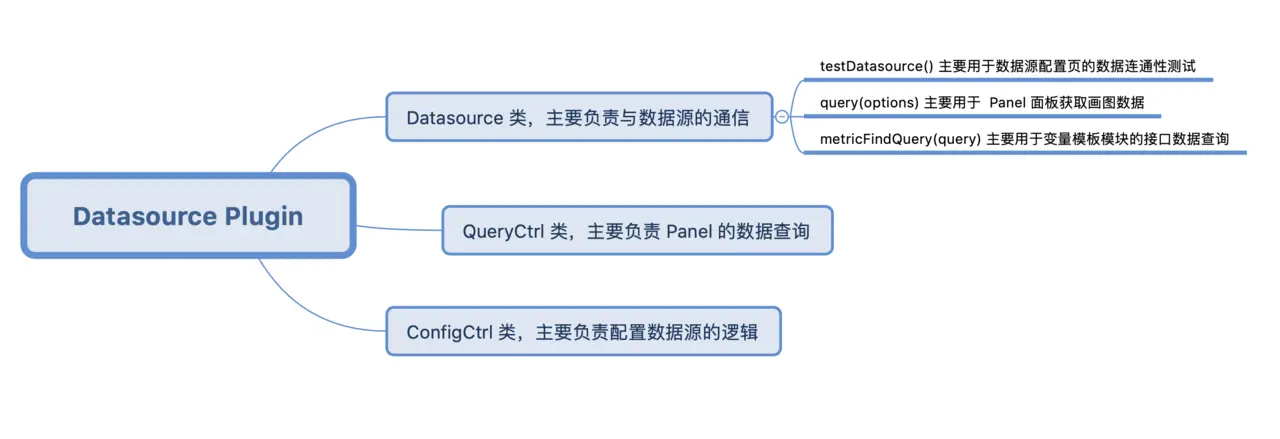
Datasource
Datasource 类作为数据入口,主要负责与数据源进行通信。 针对 Tencent Cloud Monitor App 中不同的产品,都必须有一个对应 Datasource 实现类。因此我们定义了一个 Datasource 类的接口协议,每个产品的 Datasource 类都必须遵循这个接口协议:
interface DatasourceInterface {
instanceSettings: any;
backendSrv: any;
templateSrv: any;
query(options: any);
testDatasource();
metricFindQuery(query: any);
getRegions(service: string);
getMetrics(service: string, region: string);
getInstances(service: string, region: string, params: any);
getZones?: (service: string, region: string) => any;
}
备注:
// Datasource 类如果要实现以下功能函数,则必须遵循 Grafana 命名协议约定,所以 Datasource 类的接口协议也是按照该要求进行设计。
query(options) // Required, used by panels to get data
testDatasource() // Required, used by datasource configuration page to make sure the connection is working
annotationQuery(options) // used by dashboards to get annotations
metricFindQuery(options) // used by query editor to get metric suggestions.
Datasource 类的主要代码:
/* Datasource Plugin 中的 datasource 类 */
import { Datasources, SERVICES } from './tc_monitor'; // Datasources 是每个云产品对应的 Datasource 实现类组成的对象
export class TCMonitorDatasource implements DatasourceInterface {
instanceSettings: any;
backendSrv: any;
templateSrv: any;
/** @ngInject */
constructor(instanceSettings, backendSrv, templateSrv) {
this.instanceSettings = instanceSettings;
this.backendSrv = backendSrv;
this.templateSrv = templateSrv;
_.forEach(Datasources, (_class, key) => { // 自动实例化每个云产品的 Datasource 类
this[key] = new _class(this.instanceSettings, this.backendSrv, this.templateSrv);
});
}
testDatasource() {...} // 根据选中的云产品去调用每个云产品 Datasource 类中对应的 testDatasource()
query(options) {...} // 根据选中的云产品去调用每个云产品 Datasource 类中对应的 query()
metricFindQuery(query) {...} // 根据选中的云产品去调用每个云产品 Datasource 类中对应的 getRegions()
getRegions() {...} // 根据选中的云产品去调用每个云产品 Datasource 类中对应的 getMetrics()
getMetrics() {...} // 根据选中的云产品去调用每个云产品 Datasource 类中对应的 getZones()
getInstances() {...}
getZones() {...}
}
/*CVM 产品中的 datasource 模块*/
export default class CVMDatasource implements DatasourceInterface {
constructor() {...}
testDatasource() {...}
query(options) {...}
metricFindQuery(query) {...}
getRegions() {...}
getMetrics() {...}
getInstances() {...}
getZones() {...}
}
tc_monitor 目录中增加对应子目录实现各自的 datasource.ts 类(继承DatasourceInterface 协议),再在tc_monitor 目录的 index.tx 文件中通过 Datasources 配置该类入口。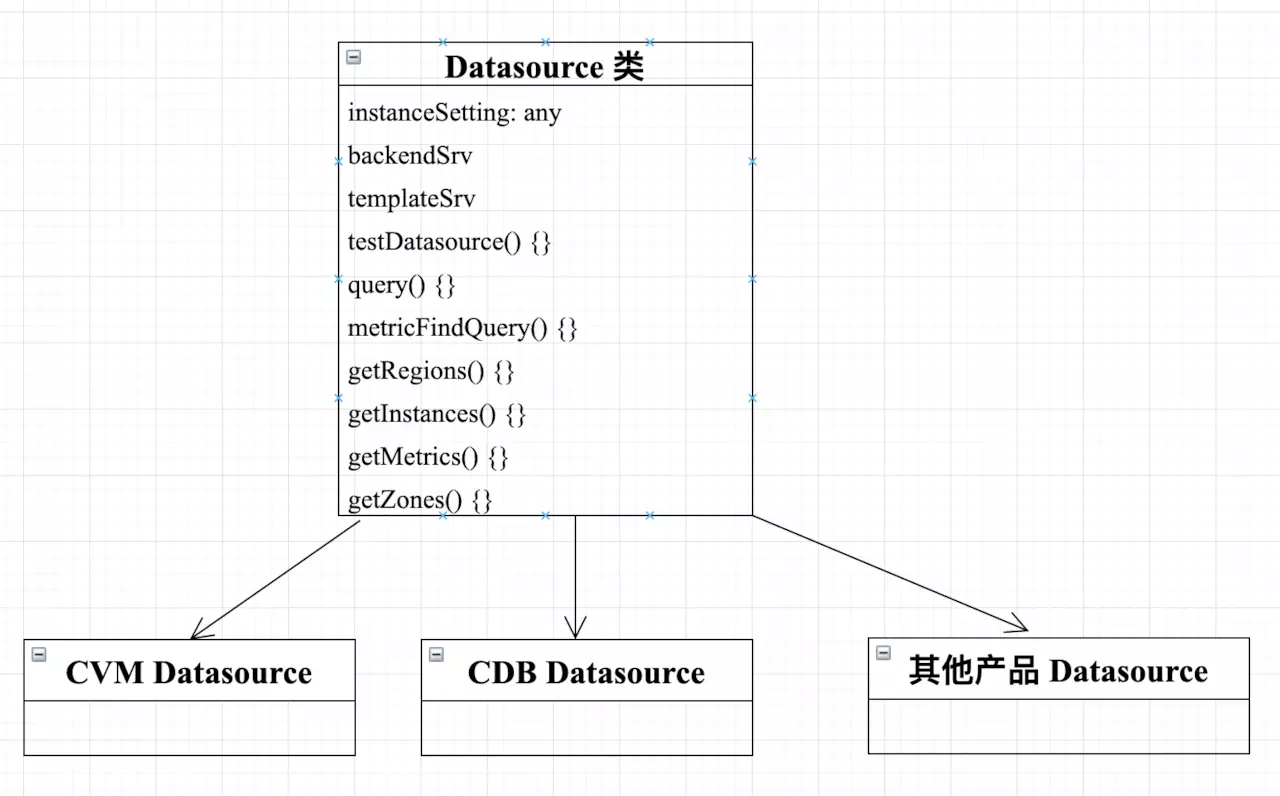
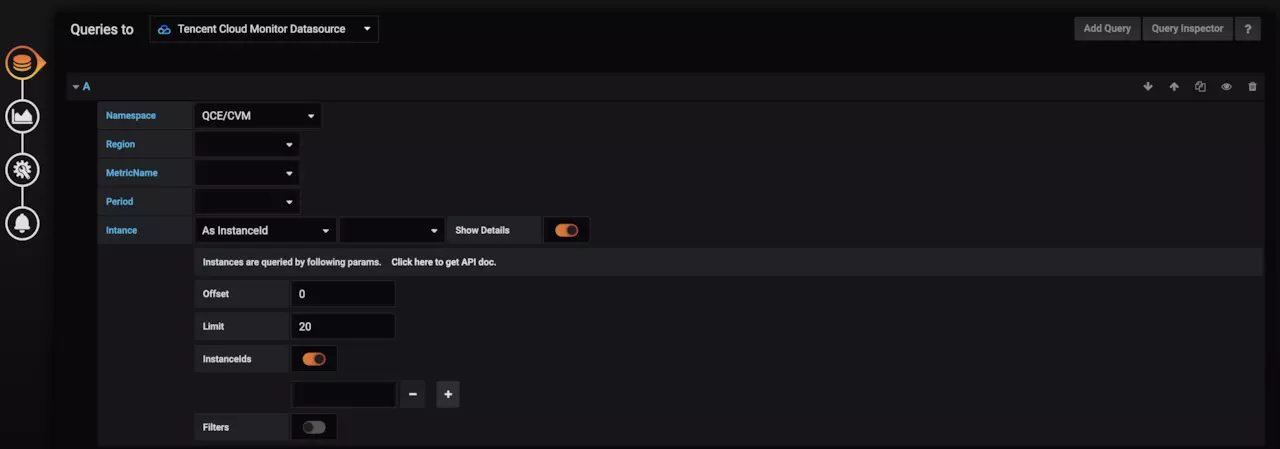
QueryCtrl
当用户在 Dashboard 页面对 Panel 进行编辑时,QueryCtrl 类将被实例化并作为 Angular 控制器,并根据类中的 templateUrl 去加载对应的 View 视图,以图形化的界面提供接口数据查询。该类必须继承自 grafana/app/plugins/sdk。具体页面展示以及主要代码逻辑如下:
import { QueryCtrl } from 'grafana/app/plugins/sdk';
export class TCMonitorDatasourceQueryCtrl extends QueryCtrl {
static templateUrl = 'datasource/partials/query.editor.html';
datasource: any; // 对应 datasource.ts 实例的对象
panelCtrl: any; // 对应 Panel 的实例对象
target: { // 具体的查询条件信息保存
refId: string;
namespace: string;
service: string;
showInstanceDetails: boolean;
};
defaults = { // 初始化值
namespace: '',
service: '',
showInstanceDetails: false,
...InitServiceState,
};
lastQuery: string;
lastQueryError?: string;
/** @ngInject */
constructor($scope, $injector, private templateSrv) {
super($scope, $injector);
_.defaultsDeep(this.target, this.defaults);
this.panelCtrl.events.on('data-received', this.onDataReceived.bind(this), $scope);
}
// Panel 实例的数据接收处理函数
onDataReceived(dataList) {
this.lastQueryError = undefined;
this.lastQuery = '';
const anySeriesFromQuery: any = _.find(dataList, { refId: this.target.refId });
if (anySeriesFromQuery) {
this.lastQuery = anySeriesFromQuery.query;
}
}
// Panel 数据查询失败的调用函数
onDataError(err) {
this.handleQueryCtrlError(err);
}
handleQueryCtrlError(err) {...}
// 省略其它详细代码
}
对应视图 View 中的部分代码如下,<query-editor-row query-ctrl="ctrl"></query-editor-row> 标签的内容会加入到Add Query模板中:
<query-editor-row query-ctrl="ctrl" class="generic-datasource-query-row" has-text-edit-mode="true">
<div class="gf-form-inline">
<div class="gf-form">
<label class="gf-form-label query-keyword width-9">Namespace</label>
<div class="gf-form-select-wrapper gf-form-select-wrapper--caret-indent">
<select class="gf-form-input min-width-12" ng-model="ctrl.target.namespace" ng-options="f as f for f in ctrl.namespaces"
ng-change="ctrl.onNamespaceChange()"></select>
</div>
</div>
</div>
<!-- 省略更多详情 -->
<!-- 新增不同的云产品,需要在该处增加新产品独有的配置页面 -->
<!-- CVM -->
<cvm-query
ng-if="ctrl.target.service==='cvm'"
target="ctrl.target.cvm"
show-detail="ctrl.checkShowDetail('instance')"
datasource="ctrl.datasource"
on-change="ctrl.onInstanceQueryChange()"
region="ctrl.replace(ctrl.target.cvm.region)"
></cvm-query>
<!-- Global error message -->
<div class="gf-form" ng-show="ctrl.lastQueryError">
<pre class="gf-form-pre alert alert-error">{{ctrl.lastQueryError}}</pre>
</div>
</query-editor-row>
Namespace、Region、MetricName、 Period、 Insatnce 查询条件是腾讯云产品共有的,其业务逻辑实现在 QueryCtrl 类中。对于自定义业务,则可在自定义QueryCtrl 类中实现单独的 Angular 组件。以上面图片显示的面板为例,其中 ShowDetail 控制获取特定业务的实例列表数据,因此需抽象到单独的 Angular 组件中。新增产品则需要在 tc_monitor 目录实现各自的 query.ts 类,并在 index.tx 文件中通过 import 注册该组件,则对应在 query.editor.html 中引入产品实现的组件即可。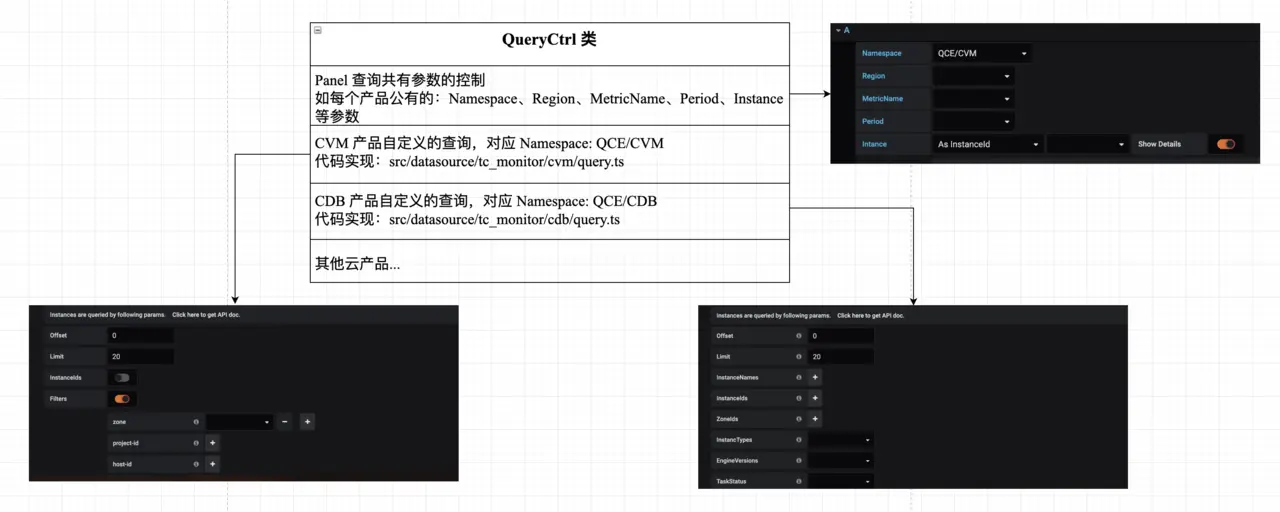
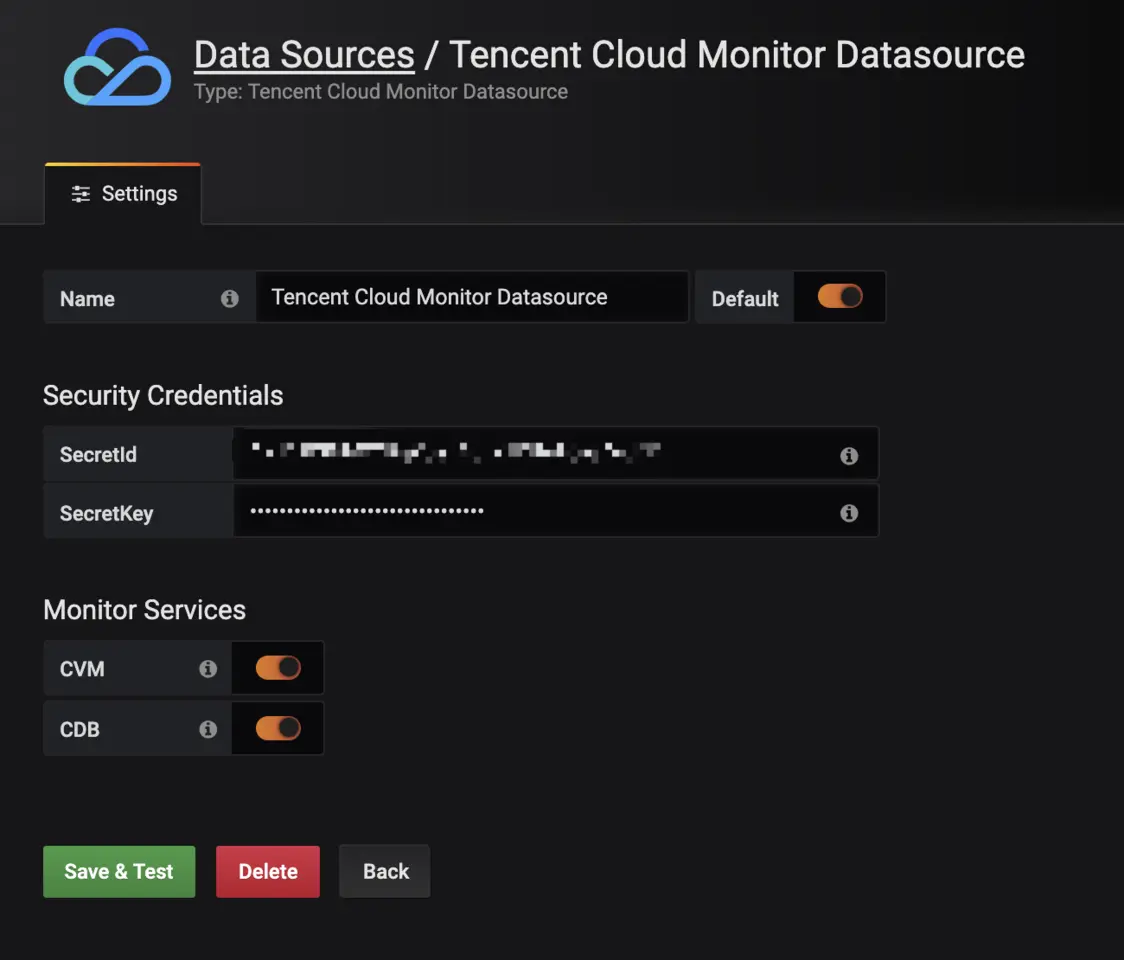
ConfigCtrl 类
ConfigCtrl 类是添加数据源的面板进行控制。 当用户对该 App Plugin 的数据源进行配置时,该类会被实例化为 Angular 的控制器,并根据类中的 templateUrl 去加载对应的 View 视图,用于呈现数据源自定义配置的面板。具体页面展示示例如下:
/* 文件路径为 /src/datasource/config.ctrl.ts */
import * as _ from 'lodash';
import { SERVICES } from './tc_monitor';
export class TCMonitorDatasourceConfigCtrl {
static templateUrl = 'datasource/partials/config.html'; // 指定该Controller 对应 View 文件,且实际路径为 /src/datasource/partials/config.html
current: any;
/** @ngInject */
constructor($scope) {
this.current.jsonData.services = SERVICES;
_.forEach(this.current.jsonData.services, (service) => {
this.current.jsonData[service.service] = true;
});
}
}
结束
Tencent Cloud Monitor App 已经在 github.com 上开源了,欢迎大家多提 issues,顺便给我们 Star 鼓励一下。
项目地址:TencentCloud/tencentcloud-monitor-grafana-app (github.com/TencentClou…)
项目代码开发成员:
- susiezhao(github.com/susiezhao)
- taoran34(github.com/taoran34)
本文转载自链接:https://juejin.im/post/5cdea925f265da1b7c60e702