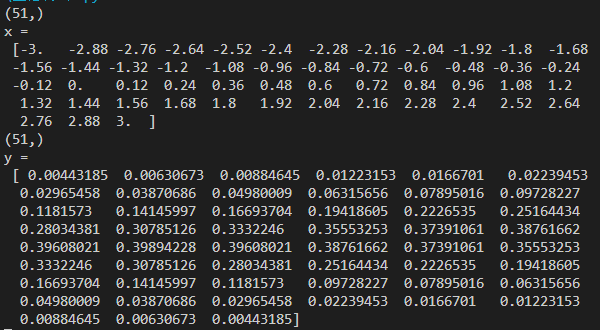
代码
import numpy as np
import matplotlib.pyplot as plt
import matplotlib as mpl
import math
mpl.rcParams['font.sans-serif'] = [u'SimHei']  #FangSong/黑体 FangSong/KaiTi
mpl.rcParams['axes.unicode_minus'] = False
mu = 0
sigma = 1
x = np.linspace(mu - 3 * sigma, mu + 3 * sigma, 51)
y = np.exp(-(x - mu) ** 2 / (2 * sigma ** 2)) / (math.sqrt(2 * math.pi) * sigma)
print(x.shape)
print('x =
', x)
print(y.shape)
print('y =
', y)
plt.figure(facecolor='w')
plt.plot(x, y, 'ro-', linewidth=2)
plt.plot(x, y, 'r-', x, y, 'go', linewidth=2, markersize=8)
plt.xlabel('X', fontsize=15)
plt.ylabel('Y', fontsize=15)
plt.title(u'高斯分布函数', fontsize=18)
plt.grid(True)
plt.show()
结果

