在elasticsearch中存储数据的行为就叫做索引(indexing),不过在索引之前,我们需要明确数据应该存储在哪里。
在elasticsearch中,文档归属于一种类型(type),而这些类型存在于索引(index)中,我们可以画一些简单的对比图来类比传统的关系型数据库。
relation DB -- Database --- Tables -- Rows ---Coumns
elasticsearch -- Indices --- Types --Documents--Fields
elasticsearch集群可以包含多个索引(indices)(数据库),每一个索引可以包含多个类型(types)(表),每一个类型包含多个文档(documents)(行),然后每个文档包含多个字段(Fields)(行).
ELK的整套解决方案如下:
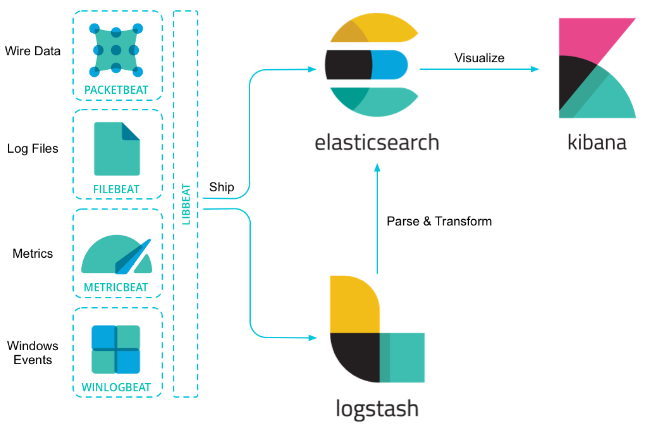
其中Metrics主要用来监视CPU等系统资源消耗情况。具体安装操作如下:
一、安装metricbeat应用软件
二、导入beats-dashboards模板
A.在线安装时,运行如下命令:
./scripts/import_dashboards -es http://XXX:9200
B.离线安装时,运行如下命令:
./scripts/import_dashboards -file beats-dashboards-5.2.1.zip -es http://XXX:9200
参见:http://wangzhijian.blog.51cto.com/6427016/1878636
一、elasticsearch单机环境搭建
注:elasticsearch对JDK版本这有严格的要求,一般建议安装Java: openjdk version "1.8.0_xx"
配置ElasticSearch
tar -zxvf elasticsearch-5.2.2.tar.gz
cd elasticsearch-5.2.2
编辑ES的配置文件,修改以下配置项:
cluster.name=es_cluster
node.name=node0
path.data=/tmp/elasticsearch/data
path.logs=/tmp/elasticsearch/logs
#当前hostname或IP
network.host=XXX
network.port=9200
bootstrap.memory_lock: false
bootstrap.system_call_filter: false
启动ES:
./bin/elasticsearch或nohup ./bin/elasticsearch &
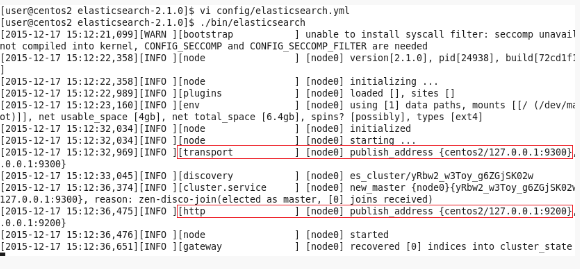
打开页面IP:9200,将会看到以下内容:
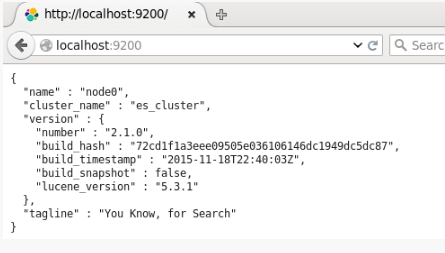
或者使用命令:curl http://IP:9200来检查部署是否成功
集群安装请参见:http://yedward.net/post/416.html
安装过程中碰到的坑如下: http://blog.csdn.net/qq_21387171/article/details/53577115及http://www.dajiangtai.com/community/18136.do
参数配置可以参见:bigbo.github.io/pages/2015/04/10/elasticsearch_config
另外在安装5.2.2版本时碰到一个报错及处理方式如下:
ERROR: bootstrap checks failed
system call filters failed to install; check the logs and fix your configuration or disable system call filters at your own risk
解决措施如下:在elasticsearch.yml中配置bootstrap.system_call_filter为false,注意要在Memory下面:
bootstrap.memory_lock: false
bootstrap.system_call_filter: false
可以查看issues:https://github.com/elastic/elasticsearch/issues/22899
二、kibana安装
1、安装准备
tar -zxvf kibana-5.2.2.tar.gz
2、配置kibana
server.port: 5601 #监听的端口号
server.host: "172.18.12.XX"  #Kibana服务的IP
elasticsearch.url: http://172.18.12.XX:9200  #es服务器的http访问路径
kibana.index: .kibana #kibana在es中的辅助索引名称
3、启动kibana
./bin/kibana
4、验证kibana是否安装成功
kibana安装成功后,通过ps -ef|grep kibana或者ps -ef|grep 5601都找不到,需要通过如下命令来检测:
fuser -n tcp 5601
kill -9 端口
检查http://IP:5601是否可以访问
kibana数据查询:totalTime: [500 TO *] AND monitorName: "KMID-M3001"